

The year-on-year reduction in the English referral-to-treatment (RTT) waiting list accelerated in August. This is good news, but there is a long way to go. The waiting list needs to shrink by nearly a million patient pathways a year until 2029, for 18 week waits to be restored in this parliament as the government has pledged.
Analysis produced for Health Service Journal by Dr Rob Findlay, Director of Strategic Solutions at Insource Ltd and founder of Gooroo Ltd
Targets are currently based on eliminating the longest waits. But NHS England’s latest elective recovery bulletin says the NHS “will need to soon make the transition from a long wait focus back to the 18 week standard”. We can therefore expect the 2025-26 planning round, which is now getting underway, to require a full year of progress towards that goal. Just one in twenty local NHS specialties are currently achieving this statutory standard, and all will need to establish the right direction of travel.
In the following discussion, all figures come from NHS England. You can look up your trust and its prospects for achieving the waiting time targets here.
The numbers
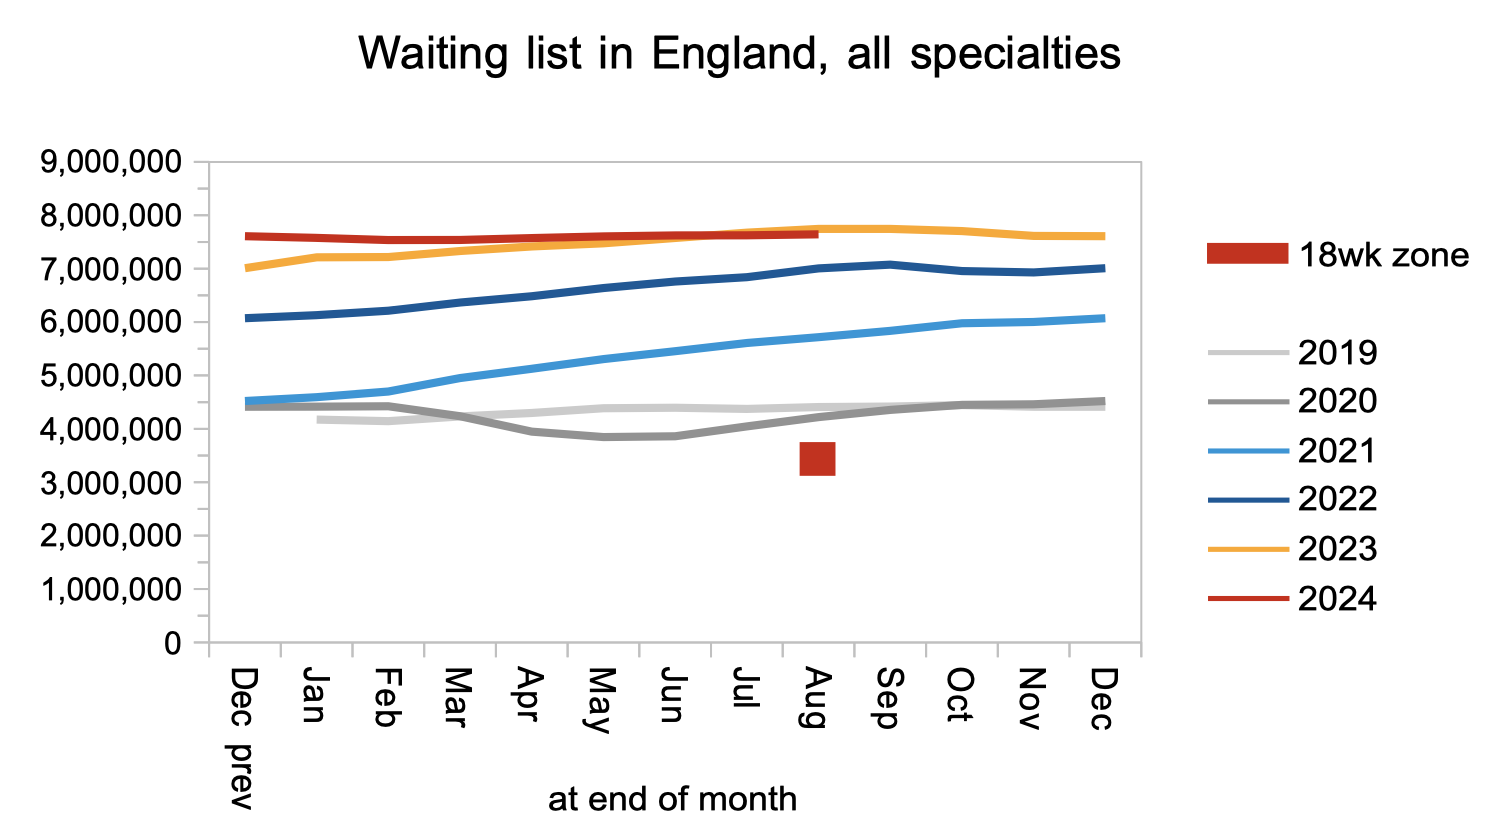
The English waiting list is now shrinking, and the trend of the last two years is for this to accelerate – as it must, to restore the 18 week standard in the current parliament.
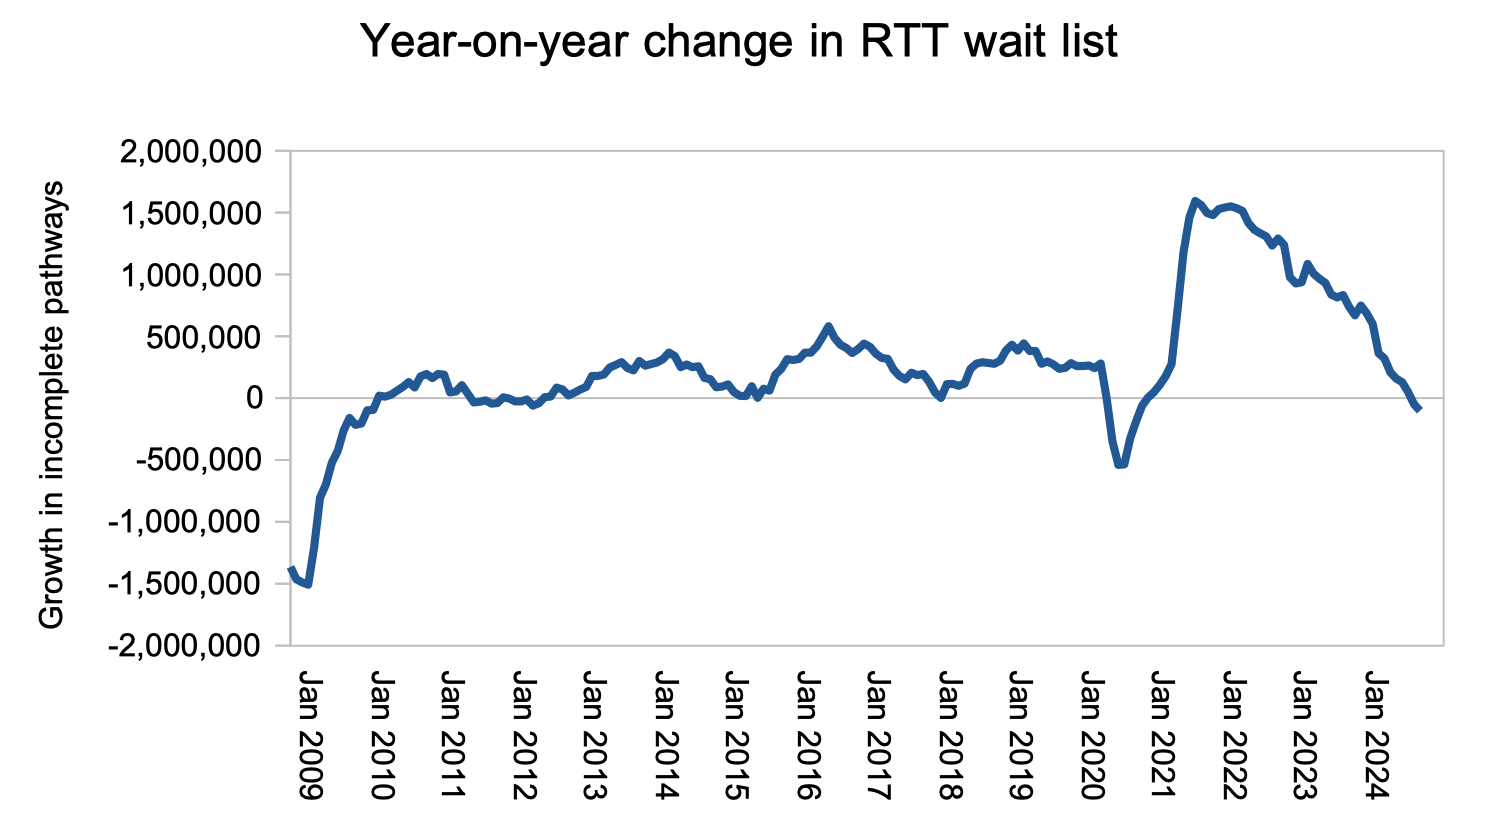
There is a long way to go. The waiting list needs to shrink by about 4 million patient pathways, or nearly one million per year, if the 18 weeks standard is to be restored by 2029. However it would be a mistake to explicitly target the size of the waiting list, because that would incentivise treating the easiest routine cases rather than those who have waited their turn in the queue.
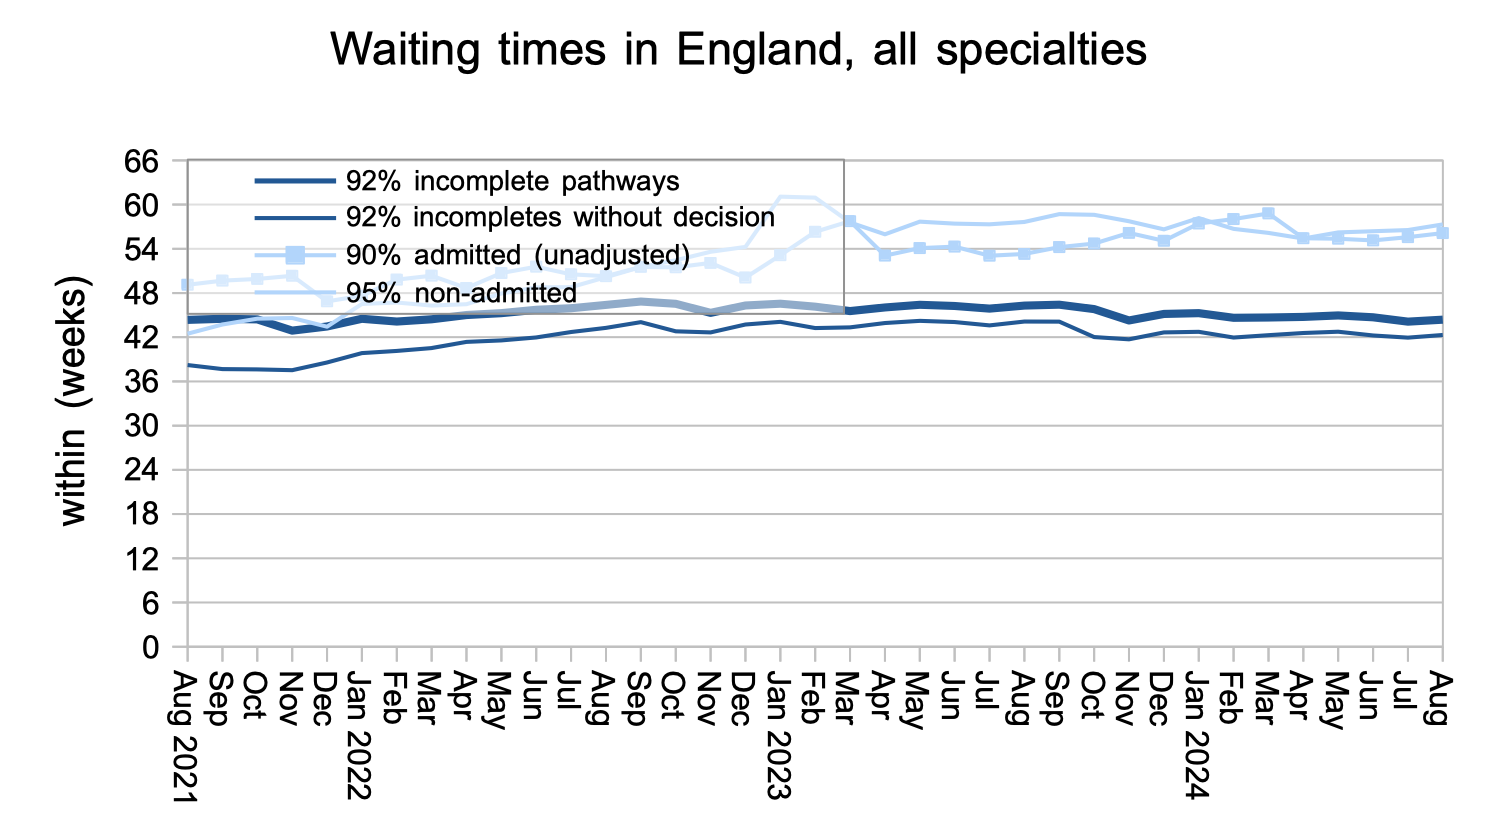
Waiting times remained very long at 44.4 weeks RTT. The typical wait time to diagnosis and decision was 42.3 weeks at the end of August, which is far too long if you are one of the estimated 28,036 patients whose eventual diagnosis will unexpectedly be cancer.
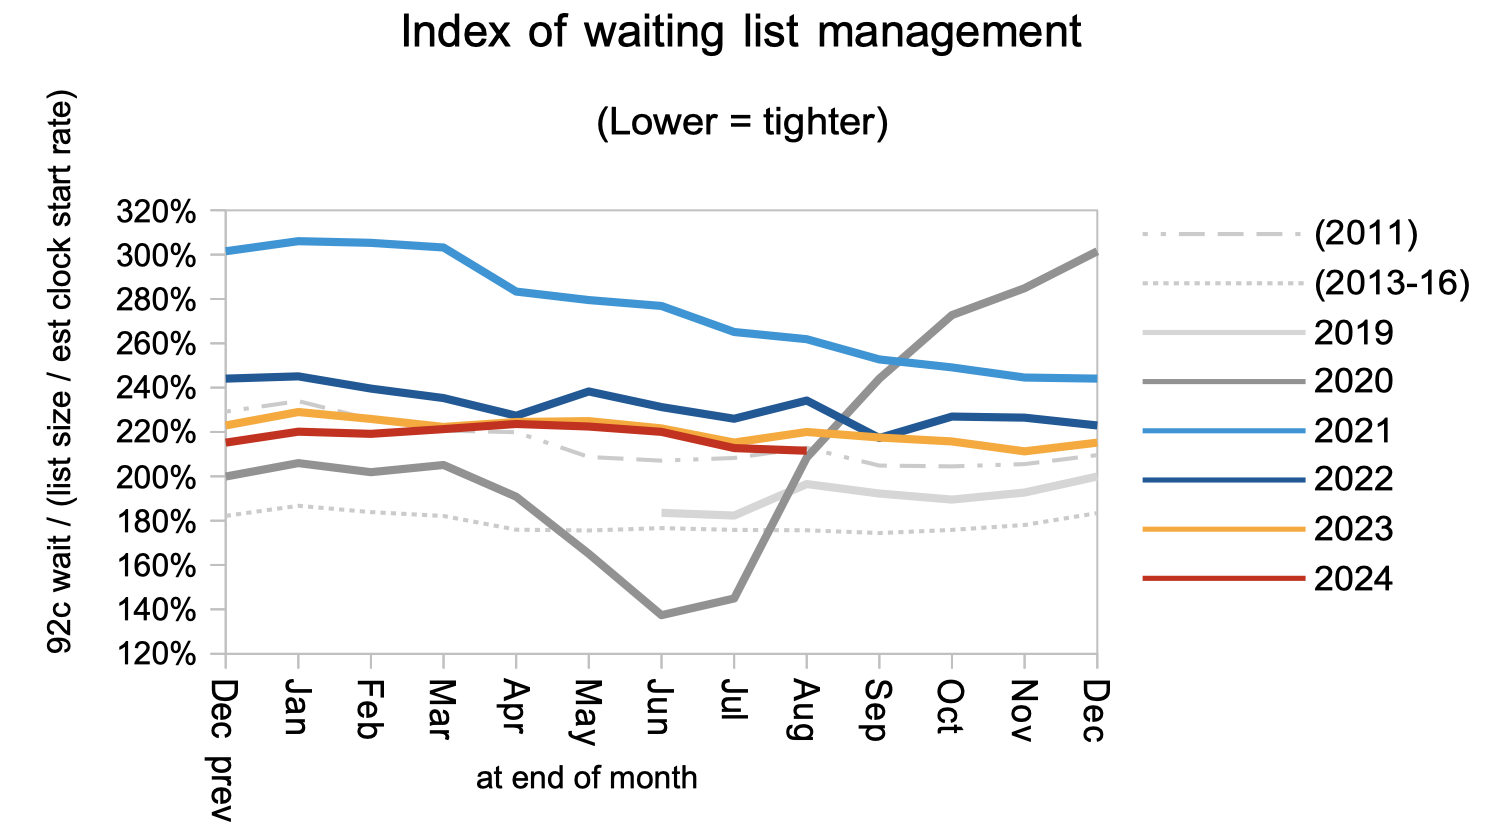
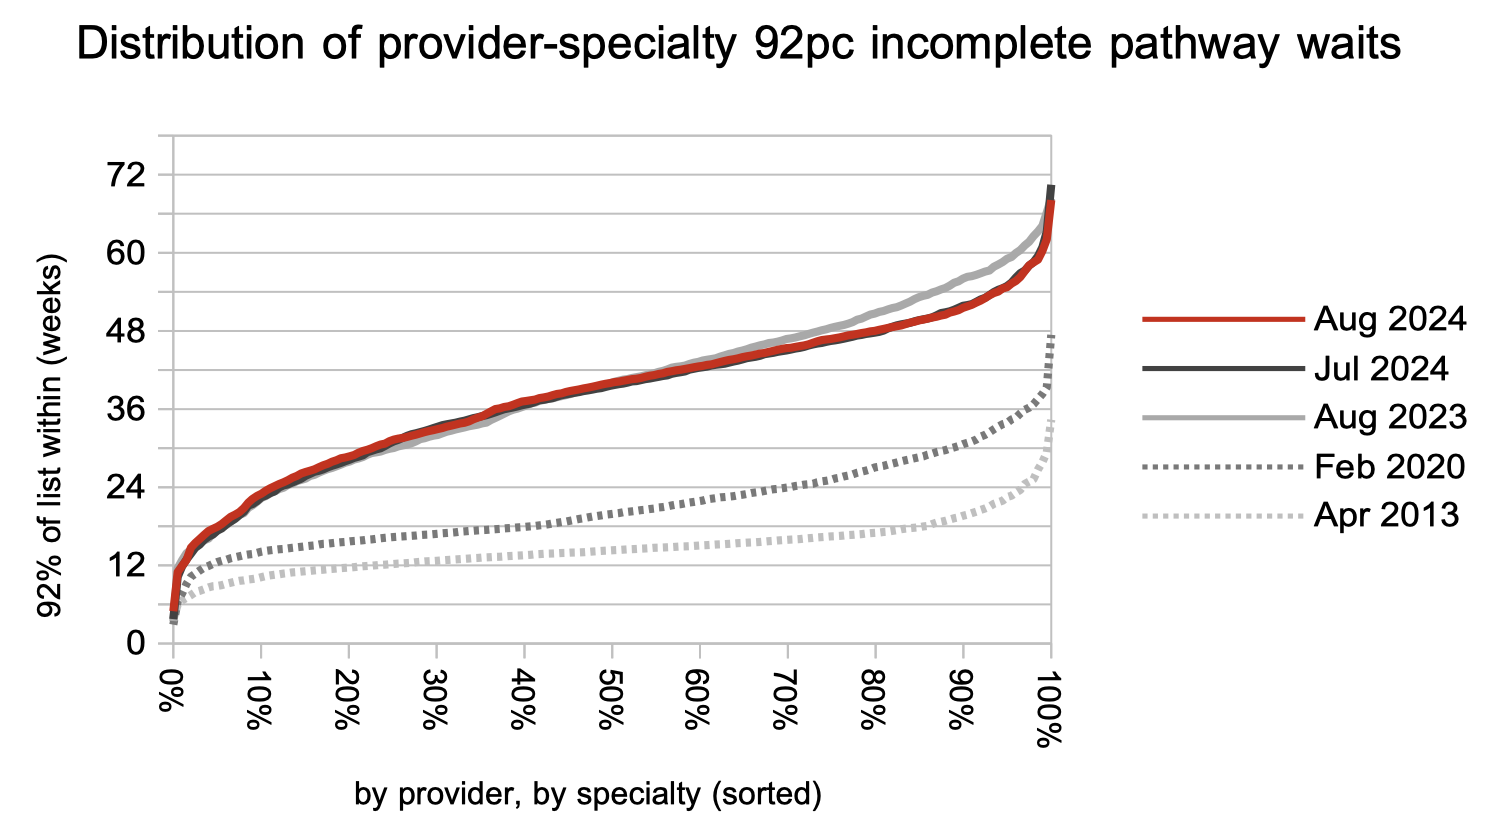
Waiting times are a function of both the size and shape of the waiting list, and the shape remains at 2011 levels. There is some way to go to restore the 2013-16 shape that was sustained following the introduction of the current statutory ’18 weeks’ standard.
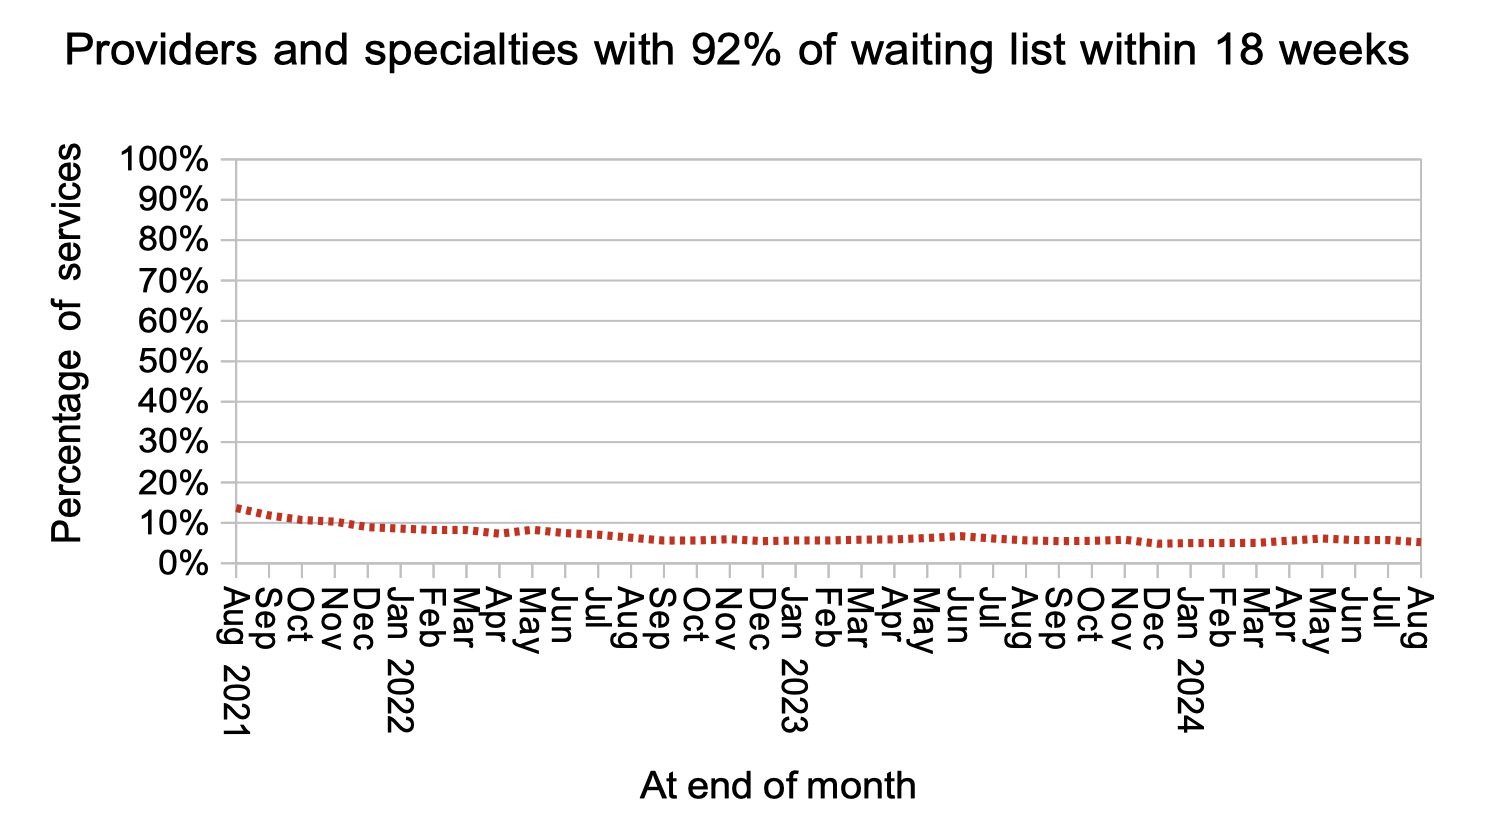
Only 5.2 per cent of local NHS specialties were achieving the 18 weeks standard.
The distribution of local NHS specialty waits has improved over the past year in the longest-waiting services, in response to the current targets to eliminate ultra long waits. The whole curve will soon need to start falling towards the April 2013 levels shown by the lowest grey line.
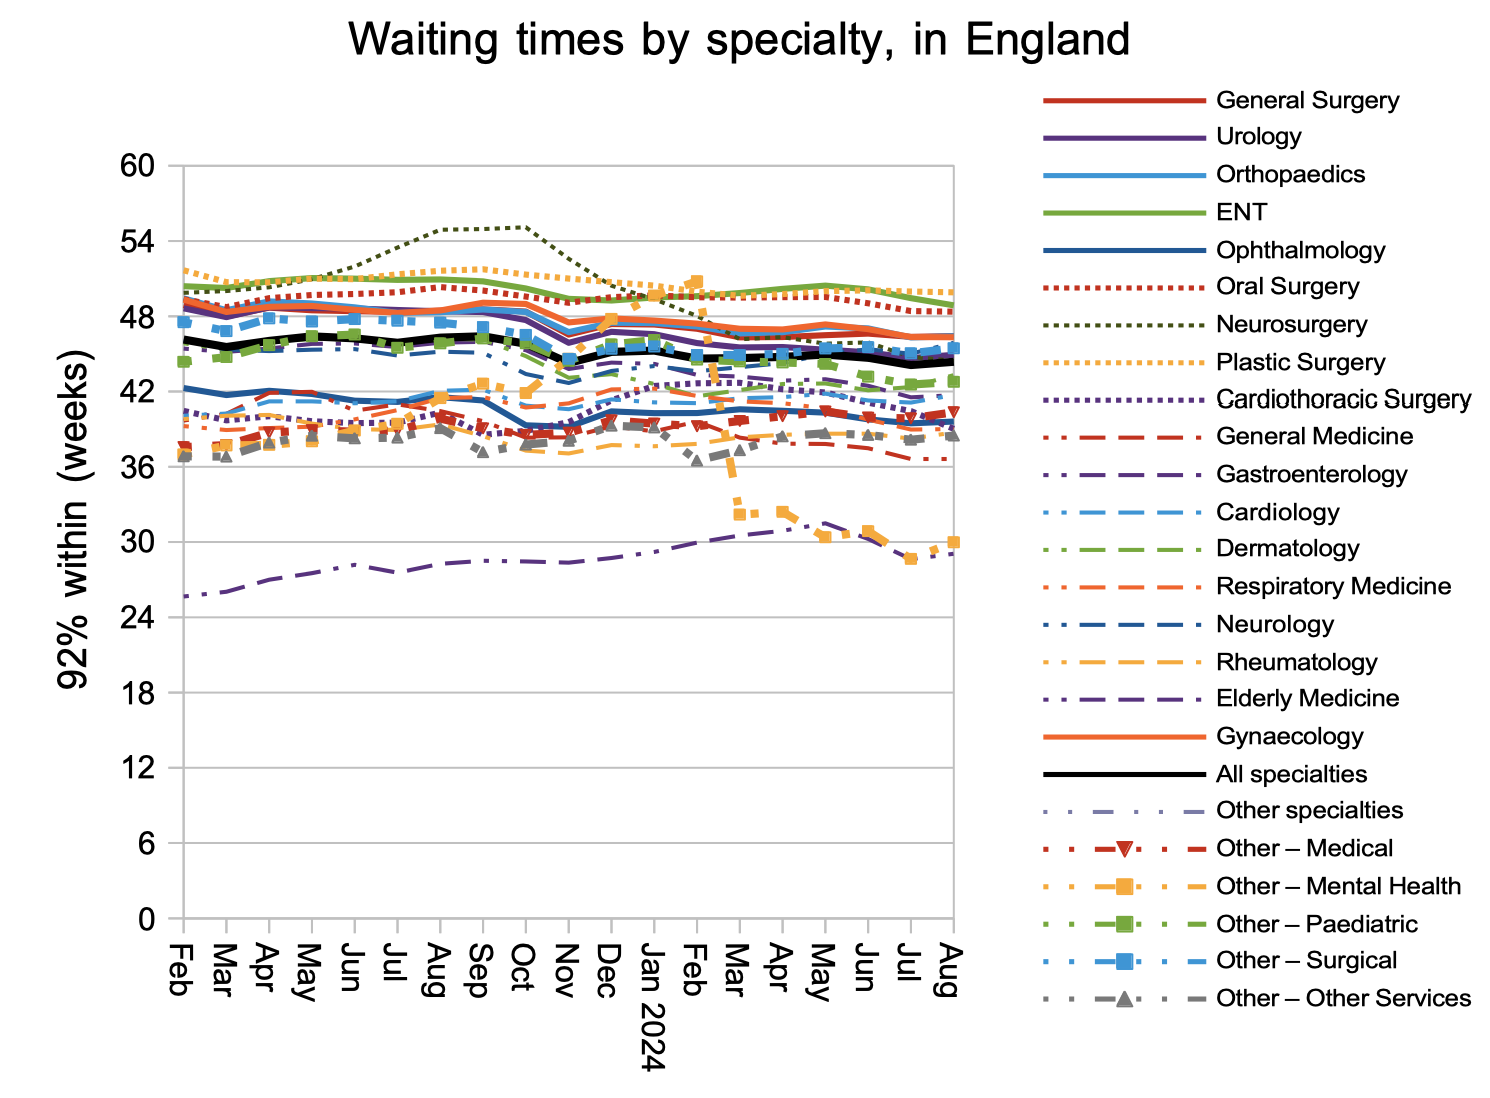
Plastic surgery had the longest waiting times nationally. Of those specialties with the biggest waiting lists, ENT was the longest-waiting specialty.
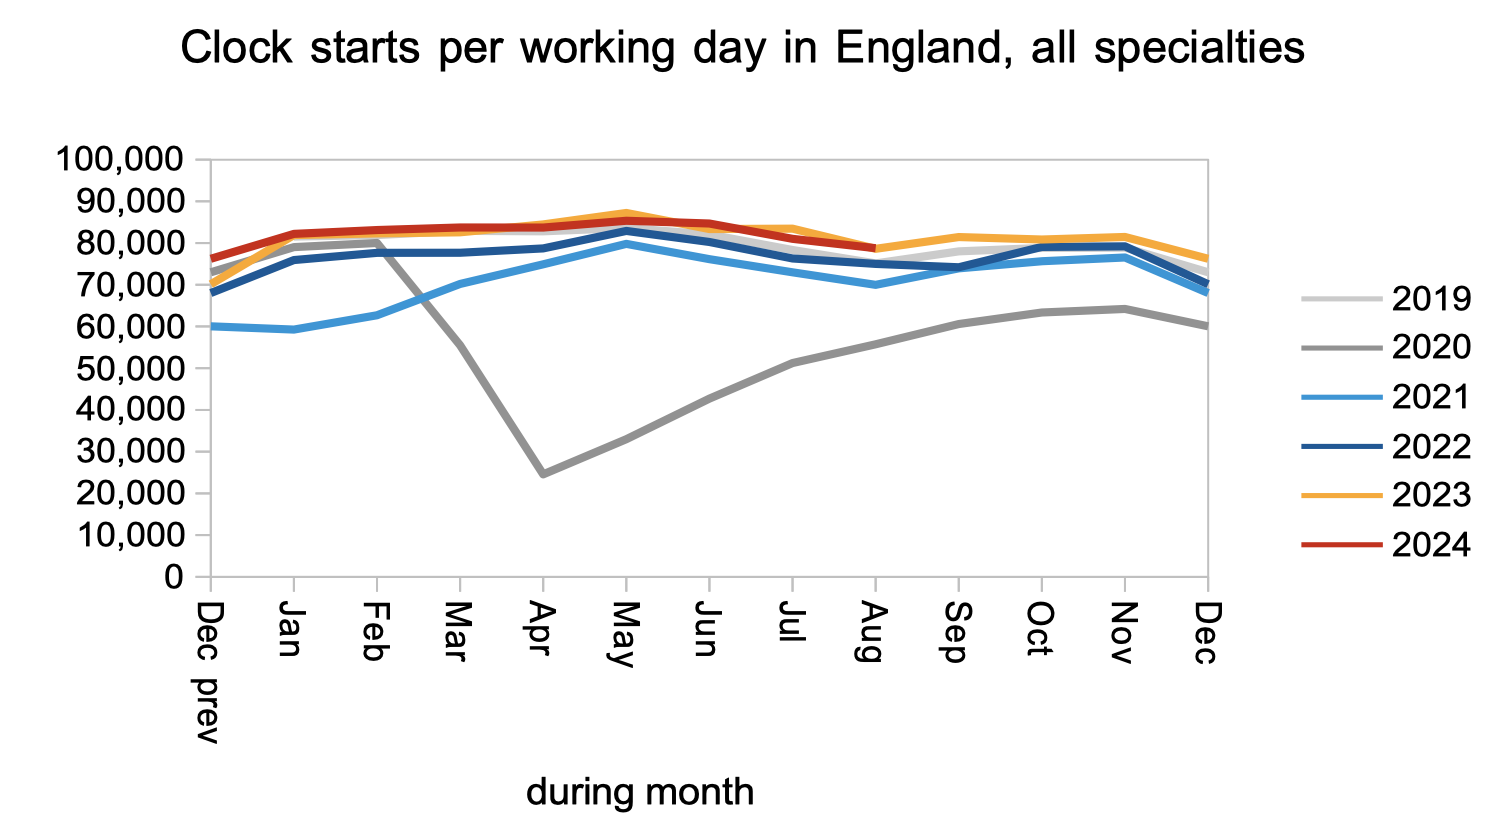
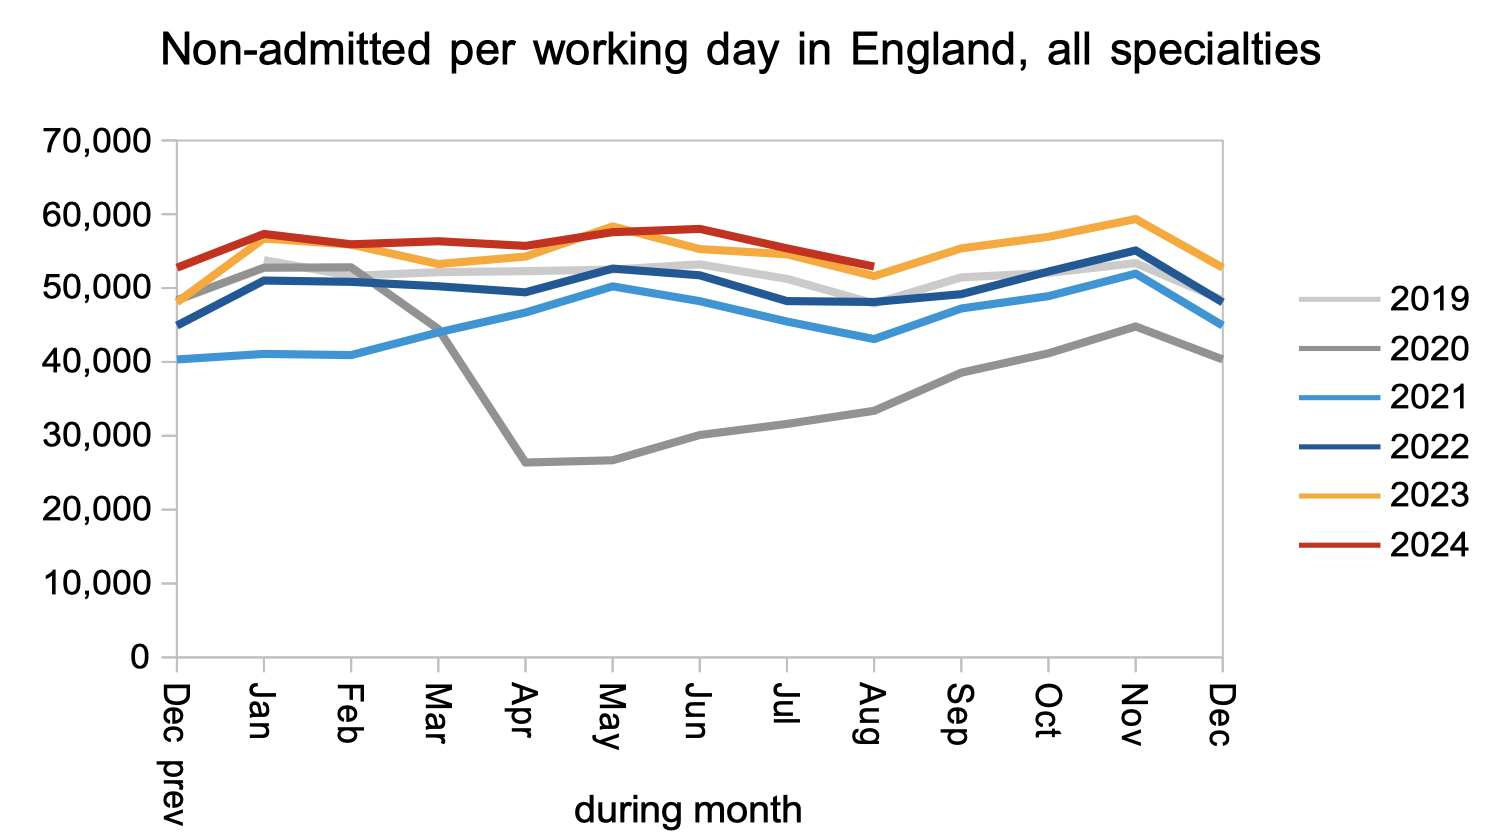
Demand for elective care remained similar to last year and slightly above pre-pandemic levels.
The rate that patients were treated and discharged from clinic, or removed administratively, remained slightly higher than last year and well above pre-pandemic levels. There are several reasons to prioritise this kind of activity. First, most of the waiting list is at the outpatient and diagnostic stage, so this is where the sheer numbers (and therefore the administrative burdens on hospitals) are highest. Second, it is clinically risky to keep undiagnosed patients waiting, especially those whose eventual diagnosis will turn out to be cancer. Finally, the NHS’s eReferral Service only functions effectively when waiting times are short enough for patients to self-book into appointment slots.
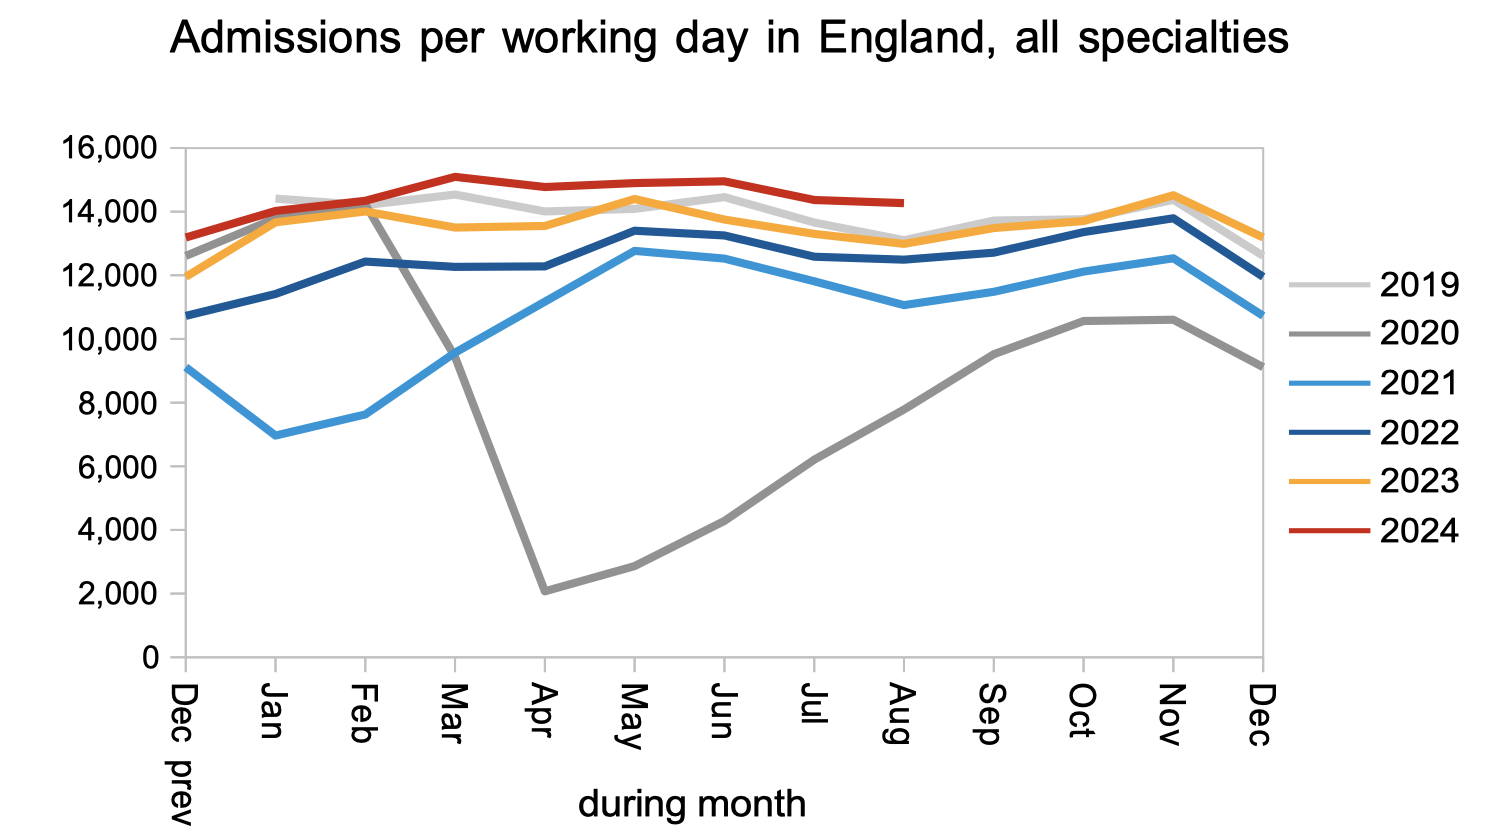
Patients were admitted for inpatient and daycase treatment significantly faster than last year and pre-pandemic, which is likely to be in response to the current targets which focus on the longest waiters who are more likely to be waiting for admission.
Referral-to-treatment data up to the end of September is due out at 9:30am on Thursday 14th November.