NHS performance reports are great at saying things like, ‘Oh look, we did 3% better than last year’. But that leaves a big, important question hanging: ‘Was it enough?’
There is only one way to answer this. You need a plan that describes ‘enough’. Then you need to compare that with what actually happened.
However at this point many NHS hospitals run into practical difficulties. They don’t have a plan that operational managers believe in. And even if they did, their information department would struggle to find the time to keep it up to date every month, or compare it against outturn in the performance reports. So that big, important question remains unanswered.
We’ll look at those practical difficulties in a moment. But first: what might the answer to that big, important question look like, if we had it?
Tracking performance properly
Let’s take performance against elective waiting time targets as an example, because it’s a major performance measure that is rather complex to track. Most hospitals simply track the measures handed down to them in national targets, but unfortunately these measures don’t reveal the cause of any problems, nor give enough advance warning if pressures are building.
Waiting times are a function of two things: the size of the waiting list, and the order in which patients are scheduled. Patient scheduling is adaptable and can be improved quickly without cost. So the more important thing to track is the size of the waiting list, because it takes time and resource to turn that around.
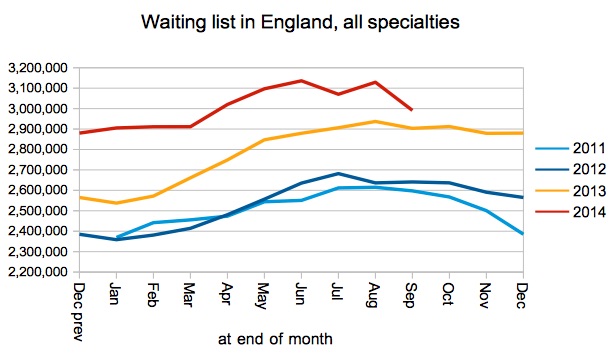
Is it that easy then? Do we just need a chart like this (complete with a nice little zoomed-in version for clarity)?
But this doesn’t tell us very much. Alright, the waiting list is getting bigger, but perhaps we expected it to grow over winter anyway? Is it growing faster than we expected, or slower? Basically, are we on track with our plan?
That’s right, we need to compare against plan. Or, even more helpfully, we need to compare it against a selection of scenarios so that we can see which one we are closest to delivering. Like this:
Now we can clearly see that this waiting list is in trouble. Not only is it much bigger than our favoured plan – which is to clear the backlog in preparation for constant capacity and achieving targets consistently from October. But it is also soaring above our maintenance plan to keep up with demand, and our backstop plan which is simply to repeat whatever happened last year.
We know we’re off track. Now we want to know why.
Is it because demand is higher than expected?
No, that isn’t it. Demand is pretty much as expected.
Is it because we didn’t do enough activity?
Yes, that’s it. Activity is falling below all our planning scenarios, even the “backstop” that simply repeats last year’s activity every week. Now we know what to do: we need to refresh our activity and capacity plan and then deliver the necessary activity to get back on track.
If we had simply tracked performance against the national waiting times targets then we wouldn’t know any of this. We might not even know there was a problem coming our way. Even if we did, we wouldn’t know if it was caused by scheduling or the size of the waiting list. And even if we knew it was the latter, we wouldn’t know if that was caused by demand or activity. This is all critical information so that we can see the problem coming and take the right action to deal with it.
How do we get all this information in real life?
How to automate planning and performance
The first step is to set up planning that operational managers can believe in, by bringing their skills and knowledge together with those of information analysts. After the initial “one day” technical implementation of Gooroo Planner, there are various things that operational managers and information analysts might consider working on to refine the modelling – there is a menu of them here. As usual, the perfect is the enemy of the good, and you will quickly get to the point where your plans are good enough to be worth tracking – you can always carry on refining them later.
So as soon as your plans are good enough, it is time to automate your planning and integrate it into your existing performance reports. It works like this:
- Every month (or every week, or whenever you like) your data queries run automatically during the night.
- The Gooroo Planner API picks up the outputs, and runs all your favourite planning scenarios.
- Your performance reports pick up the results, and drop them in alongside what happened in real life.
- Everybody sees them when they start work in the morning
…and nobody has to get around to doing it.
In technical terms (and in a nutshell) you set it up like this:
- Pick a server (or a computer that is never turned off) to run it all from, and download our API REST Client onto it.
- Set up all your favourite planning scenarios in the configuration file – there’s a complete list of settings in the Planner documentation on our Publications page.
- Set up Microsoft Task Scheduler to run your Gooroo data queries, then the API REST Client, and then to get your performance reports to collect the outputs from your chosen results folder. If you have any problems running the Planner API, then check out the API section of our Support site.
You’ve already automated your monthly Board performance reports, so why not automate your regular planning too? That way, whatever happens, you’ll always have an up-to-date plan.


