
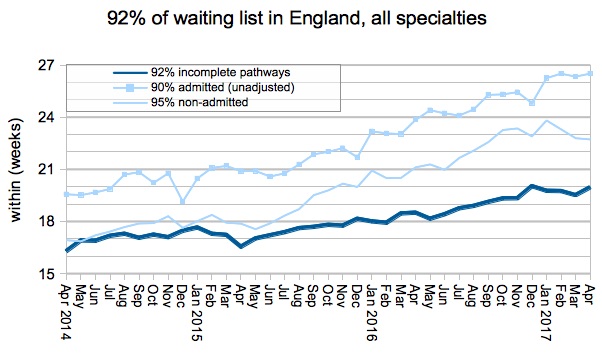
English waiting times briefly topped 20 weeks last December, but promptly fell again for the usual winter lull. Now they’re back, and this time they aren’t going away.
According to the official figures, national waiting time performance at the end of April actually squeaked in just below the psychological 20-week mark (by about 6 hours). However, if you adjust for non-reporting trusts then they definitely exceeded 20 weeks. From now on, the expected trend is up.
Of course the target is not 20 weeks but 18, though that standard has not been met since February last year. Getting back down to 18 weeks (which is a legally-binding target) would require a recurring commitment to stop the waiting list from growing, plus a substantial non-recurring commitment to undo the backlog that has built up in recent years, but whether any of that is going to happen soon is anyone’s guess. Politics may be full of surprises these days but I, for one, am not holding my breath.
In the following analysis, all figures come from NHS England. If you have a national statistic that you’d like to check up on, you can download our RTT waiting times fact checker.
England-wide picture
The winter lull in waiting times came to an end in April, and waits resumed the general upwards trend that has been established since the waiting times target was first met in 2012. If the pattern of recent years continues then waits can be expected to remain permanently above 20 weeks from now on.
There was no change to the list of non-reporting trusts. Even after adjusting for their last known positions, the waiting list remained just below 4 million but is expected to clear that hurdle in the coming months for the first time since 2007.
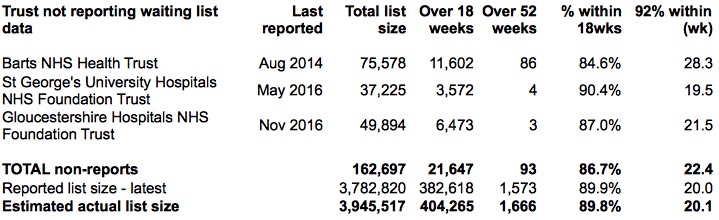
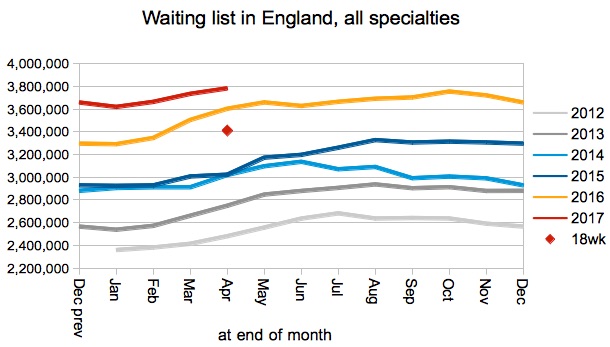
Apart from the table above, all the analysis here has been based on the unadjusted figures, and the waiting list size that is plotted below is particularly affected by trusts leaving and rejoining the data series.
If you would like to see a fully adjusted analysis, the statisticians at NHS England have done a commendably thorough job in their 2016/17 Annual Report. They confirm that the gap between this year’s list size and last has indeed narrowed, although not by as much as it did in the run-up to the 2015 general election.
The red blob below estimates the size of waiting list that is consistent with achieving the 18 week target again, other things being equal. Given that the 18 week target was last met in February 2016, it is not entirely surprising that the waiting list would have to fall to broadly that level before 18 weeks became achievable again.
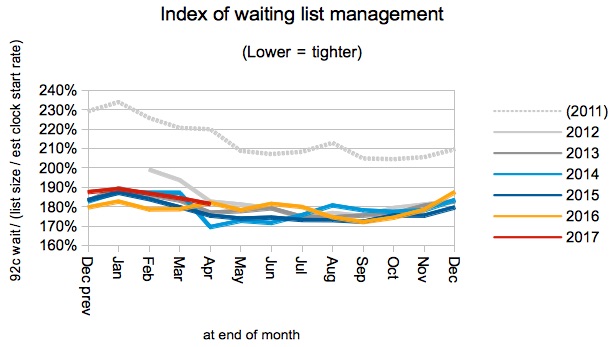
The other factor that drives waiting times is the order in which patients are treated. An index reflecting that is shown in the chart below. If people in the NHS started to give up on waiting times then this index would be expected to rise.
You may recall that financial penalties for missing the 18 week target were lifted in March, which might have heralded some degree of relaxation when it came to elective waiting times in April. Nevertheless the index continues to follow the seasonal pattern established in 2012, which is good news, and a sign that elective waiting times are still being taken seriously.
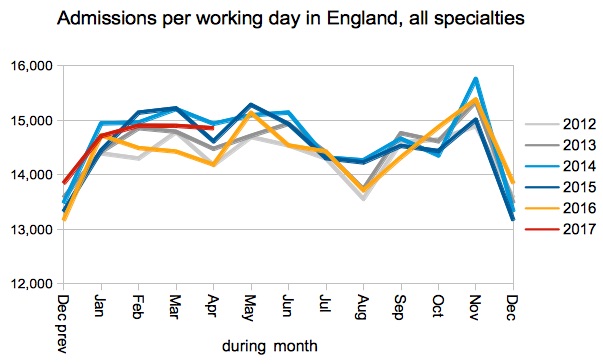
Admissions per working day remain in line with the pattern of recent years.
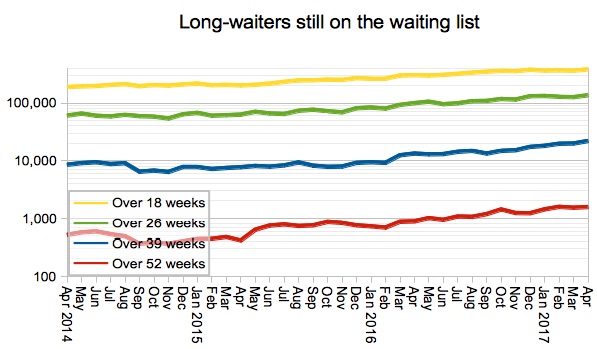
Long waits continue to rise over time. The number of over-18 week waiters is now the highest since September 2008.
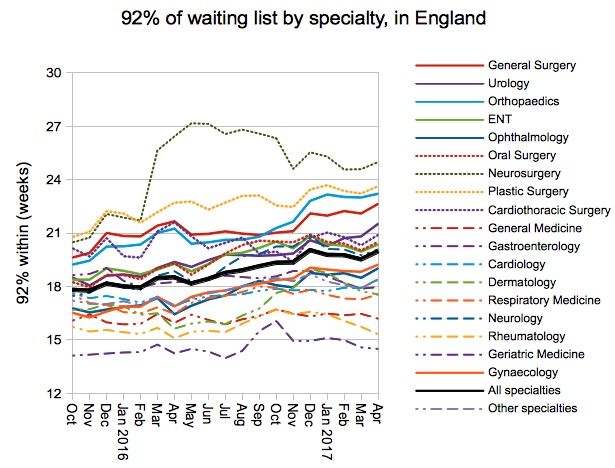
All surgical specialties remain above 18 weeks, and cardiology and “other specialties” have tipped over as well (cardiology for the first time since November 2011).
Local detail
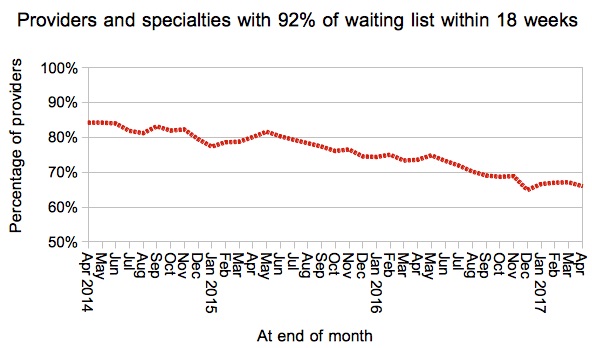
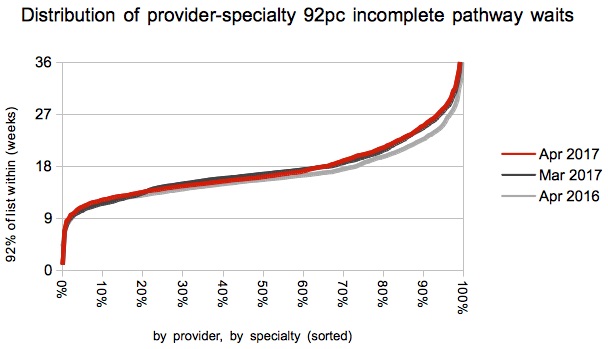
The proportion of local services achieving 18 weeks took a turn for the worse, in line with the overall picture.
The kink in March’s distribution of waiting times across local services smoothed out in April, as the year-end push to achieve 18 weeks on an all-specialties basis came to an end. Waits rose slightly again at the longer-waiting end of the spectrum.
We’ve also done some interactive maps showing the waiting times position by specialty for every Trust and CCG with significant waiting lists. If you want to look your own Trust up quickly, then visit our 18-weeks reports page.
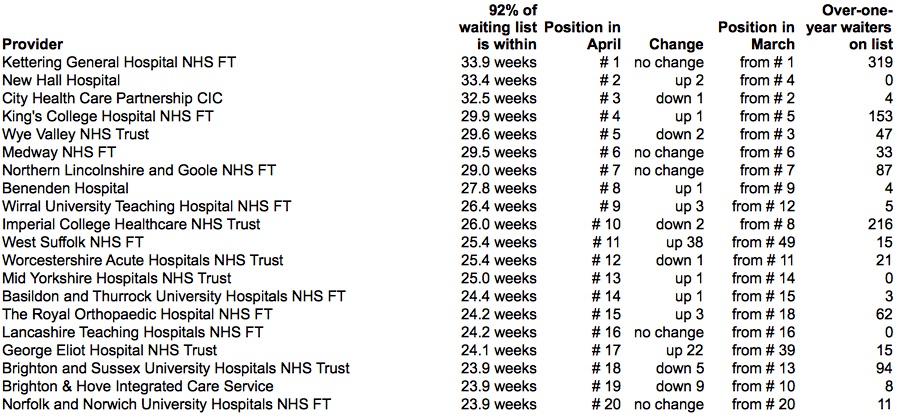
Kettering General Hospital NHS Foundation Trust remain at the top of the long-waits table, though they managed to improve their waiting times during April.
There are two new entrants in the table: West Suffolk NHS Foundation Trust have jumped 38 points to 11th place, and George Eliot Hospital NHS Trust have jumped 22 points to 17th place. Both are showing dramatic increases in their waiting times, which suggests this may reflect a change in data quality rather than real organic growth in the waiting list – an important step if it means that the figures are now more accurate.
Data for May 2017 is due out at 9:30am on 13 July.