

With patients being admitted from the waiting list at the slowest rate in years, and waiting list management running loose, you might think that waiting lists and waiting times would have risen in the autumn. Not so, according to the November figures just released by NHS England.
Unfortunately the picture is clouded by yet another large trust going on ‘reporting holiday’. But even if you factor that back in, waiting list growth held to around just 4 per cent annually which is low enough to stop waiting time pressures from rising. Waiting times duly eased back to just over 20 weeks.
For analysis of waiting times performance at a particular organisation, visit our reports page. You can also access maps of the latest waiting times across England for A&E, cancer, and RTT.
In the following discussion, all figures come from NHS England. If you have a national statistic that you’d like to check up on, you can download our RTT waiting times fact checker.
England-wide picture
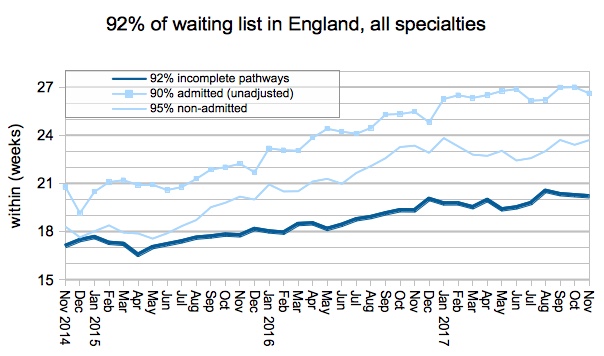
Waiting times eased back slightly to 20.2 weeks in November on the reported figures, remaining well above the 18 week standard which has been breached since March 2016.
The Royal Orthopaedic Hospital NHS Foundation Trust started reporting RTT data again, but the much larger Mid Essex Hospital Services NHS Trust dropped out. This brought the estimated number of missing patients to nearly 300,000 which is the largest number ever, and comfortably beats the previous record of 266,000 set only the previous month.
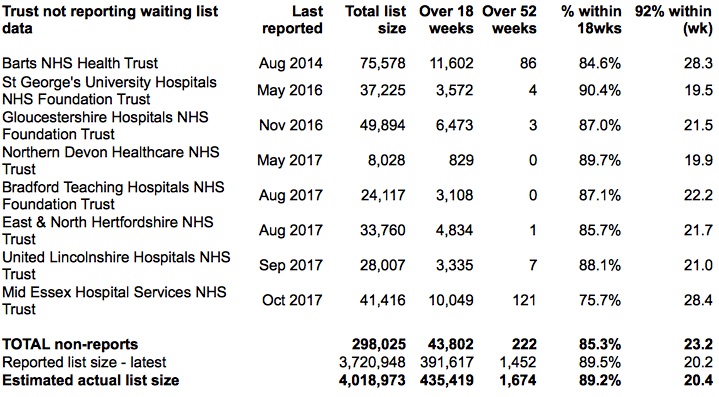
Returning now to the published figures which do not factor in non-reporting trusts, we find that the picture is unfortunately heavily skewed by non-reporting.
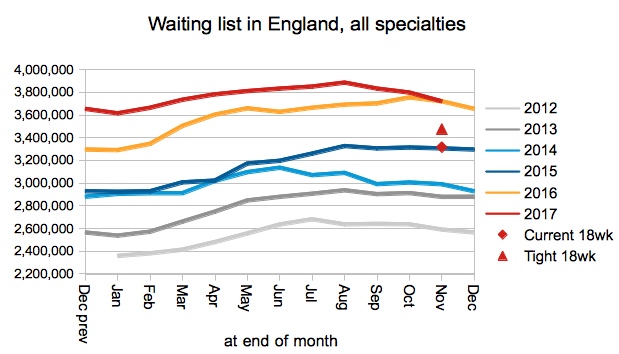
The apparent sharp drop in the size of the reported waiting list (shown in the chart below) is an illusion caused by non-reporting trusts. When those non-reporters are added back in, we find that the waiting list did fall, but only slightly, which is not unusual for the time of year. We also find that year-on-year growth in the waiting list has remained close to 4 per cent annually since April which is low enough to stop waiting time pressures from rising.
But waiting times did rise sharply in August, and that was caused by something else: a loosening of waiting list management (as the chart below shows). Since that unexpected change, the index of waiting list management has remained somewhat loose compared with recent years.
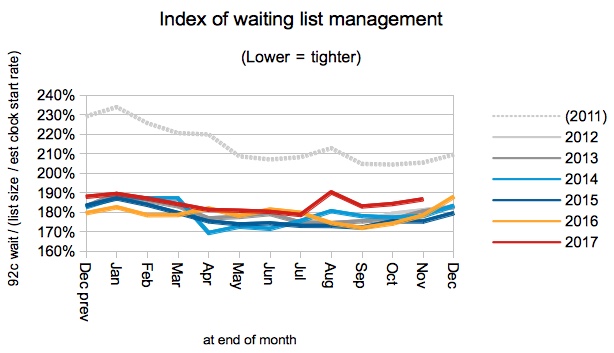
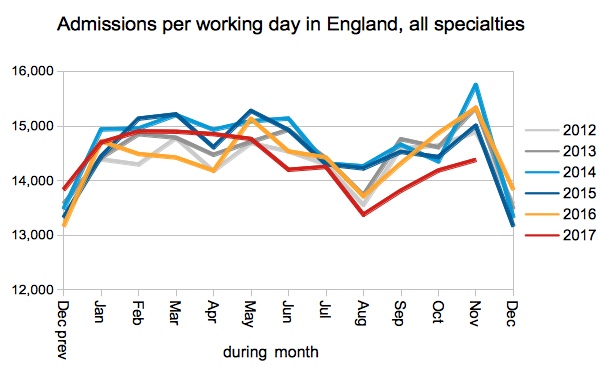
Admissions per working day remained low. It is possible that competition with non-elective services for beds could be the cause of both looser waiting list management and the relatively low admission rate.
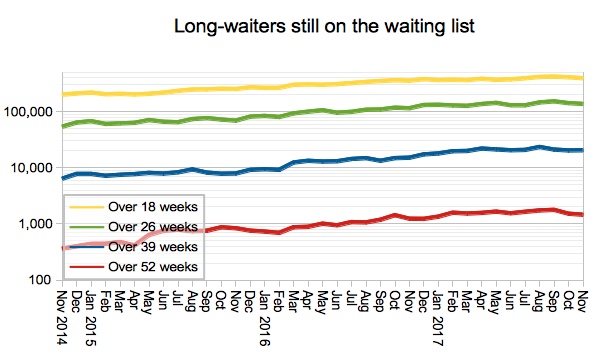
The reported number of ultra long waits remained high, although these figures are strongly affected by non-reporting trusts and should not be relied upon.
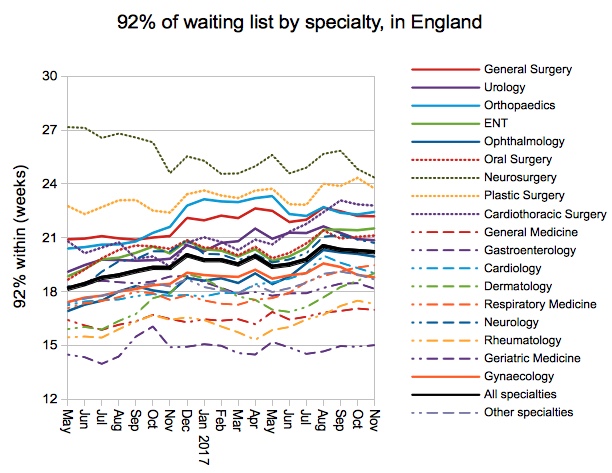
The 18 week standard continues to be breached nationally in all specialties except for three medical specialties.
Local detail
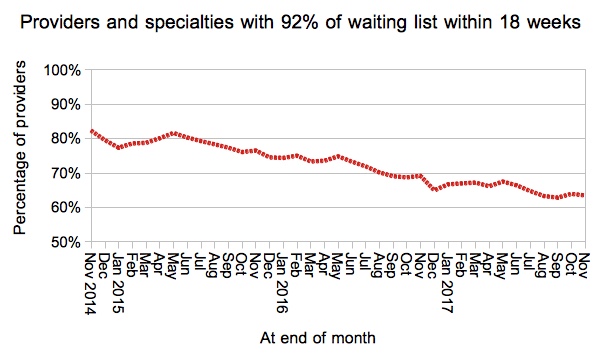
The proportion of local specialties within trusts, that are achieving the 18 week standard, remained roughly steady at 63.5 per cent, meaning that more than one-third of local services continue to breach the standard.
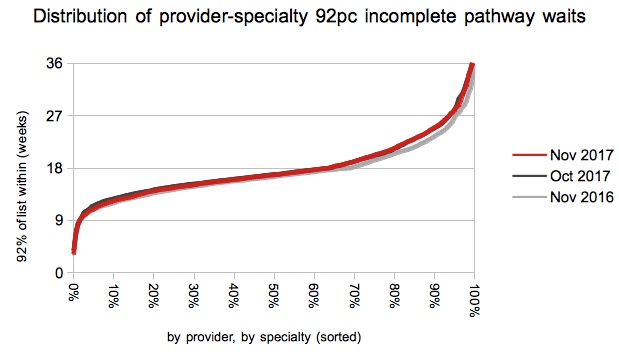
The distribution of local specialty waiting times remained steady, in line with the overall picture.
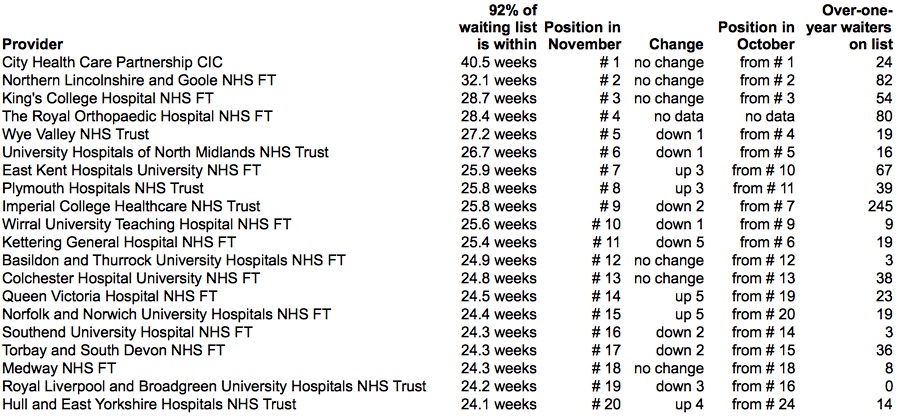
The table of the top twenty longest-waiting providers was also little changed on the previous month.
Data for December 2017 are due out at 9:30am on Thursday 8th February.