The English waiting list has grown so much that (other things being equal) the last four years of increases would need to be reversed before the iconic 18 week target could be achieved again.
According to the latest figures for November 2019, the usual autumn shrinkage in the waiting list has failed to appear for the second year running. This points to continuing long waits over winter, before seasonal waiting list growth resumes again (as it surely will) in the spring.
In the following discussion, all figures come from NHS England and NHS Improvement. If you have a national statistic that you’d like to check up on, you can download our RTT waiting times fact checker.
For analysis of waiting times performance at a particular organisation, visit our reports page. You can also access maps of the latest waiting times across England for A&E, cancer, and RTT.
England-wide picture
Waiting times are a function of the size and shape of the waiting list. Both remained broadly steady in November, so it follows that waiting times did too.

Turning briefly to the non-reporting acute trusts, Kent Community Health NHS Foundation Trust didn’t quite manage to get their numbers out in time, but they are so small in RTT terms that NHS England didn’t bother creating adjusted figures for them. So the unadjusted figures, which are used elsewhere in this report, are therefore on a comparable basis to recent months.

The waiting list has been steady all autumn, which is a bad sign because it should be shrinking in a mirror image of spring’s growth.

The waiting list shape has slumped out into a longer tail, and this is shown by the index of waiting list management below being high compared with recent years.

Admission rates from the RTT waiting list are continuing to struggle, which affects the longer-waiting patients particularly.

One year waits continue to creep back up again.

At specialty level, both neurosurgery and plastic surgery have been breaking away from the herd and heading towards 30 week waits.
At the other end of the scale. geriatric medicine – the only specialty that achieves 18 weeks at national level – has started to show growing waiting times.

The proportion of local RTT services (by specialty, by trust) achieving 18 weeks has fallen to a new low of 44.4%.

In the next chart I have added a new line to show how waiting times looked (by specialty, by trust) in the glory days of April 2013. Back then, 92 per cent of the RTT waiting list was within 15.8 weeks, which is the shortest RTT waiting time ever recorded for England.
The vertical distance between the pale grey line, and the red line, is how far waiting times have slipped in local services across the country since then. It is a shame.

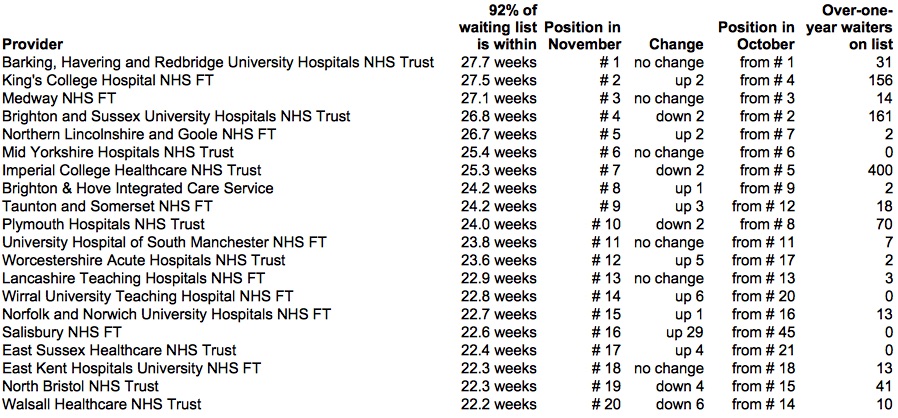
The Hillingdon Hospitals NHS Foundation Trust and Norfolk and Norwich University Hospitals NHS Foundation Trust both entered the top twenty longest waiting providers in November, as everyone else shuffled down a couple of notches.

Referral-to-treatment data for December 2019 is due out at 9:30am on Thursday 13th February. On past form, we can expect the waiting list shape to slump, leading to an uptick in waiting times.
