

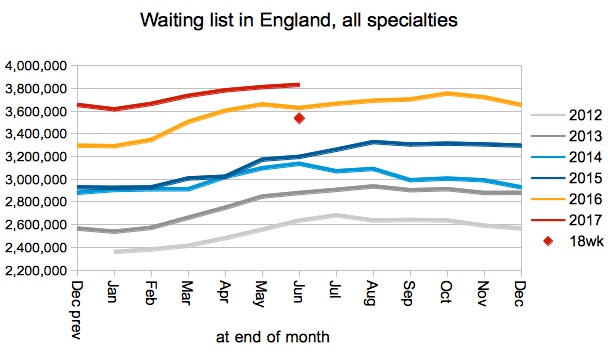
The waiting list finally rose above 4 million patients in June, according to the latest referral-to-treatment (RTT) waiting times data for England.
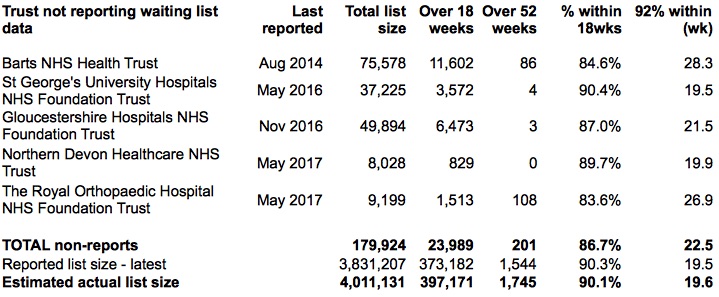
That 4 million figure is an adjusted one, because it includes the last known waiting lists at trusts who are currently not submitting data. If you leave those non-reporting trusts out then the official figure was just over 3.8 million, which is the largest since December 2007, and some two-thirds bigger than the 2.3 million achieved back in January 2009.
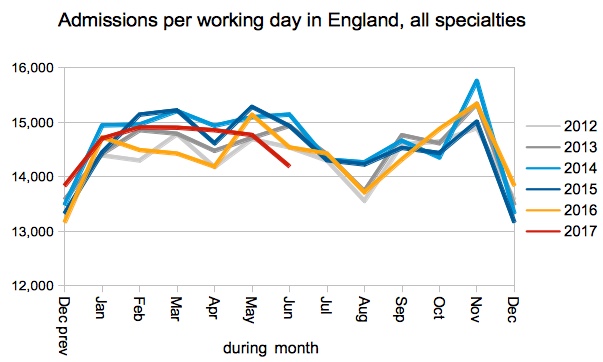
The number of admissions per working day dropped sharply to the lowest June figure since 2008. This is all rather sudden because admissions have generally held up quite consistently in recent years. But it is only a one month dip so far, and perhaps we will see a recovery in the next set of figures. If we don’t, then it could be an early sign that the renewed emphasis on A&E waiting times is starting to have an effect on elective admissions.
In the following analysis, all figures come from NHS England. If you have a national statistic that you’d like to check up on, you can download our RTT waiting times fact checker.
England-wide picture
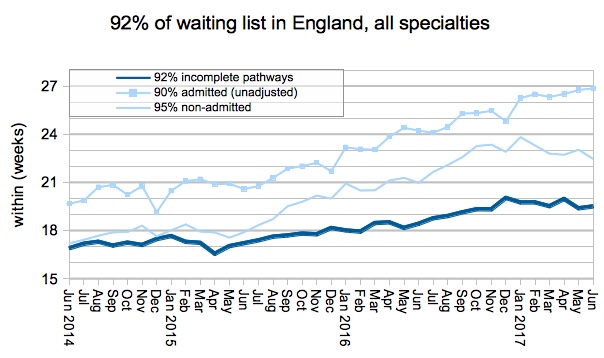
Waiting times breached the 18 week target for the 16th consecutive month, with 92 per cent of the waiting list extending to 19.5 weeks on the official figures.
Those official figures omit non-reporting trusts. Disappointingly, two more trusts have stopped reporting as Northern Devon Healthcare NHS Trust and The Royal Orthopaedic Hospital NHS Foundation Trust have now dropped out.
The waiting list crept up on the official figures, and it would need to shrink to below last year’s level before 18 weeks became achievable again.
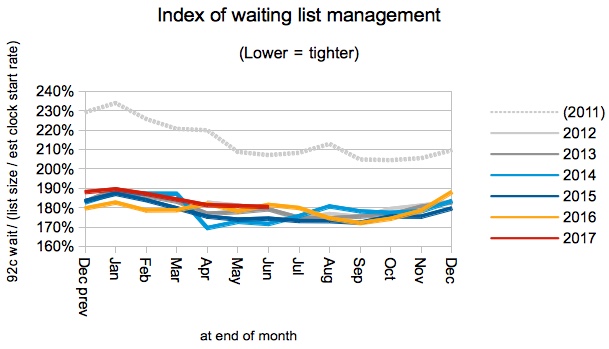
The shape of the waiting list, as indicated by the index of waiting list management below, remained stable at the levels achieved since the introduction of the incomplete pathways target in 2012. Waiting times are a function of both the size and shape of the waiting list, so this measure is important to national waiting times performance.
Admissions per working day were the lowest of any June since 2008. Let’s hope this is a one-off, because the NHS is clearly not keeping up with demand and this low admission rate is not helping.
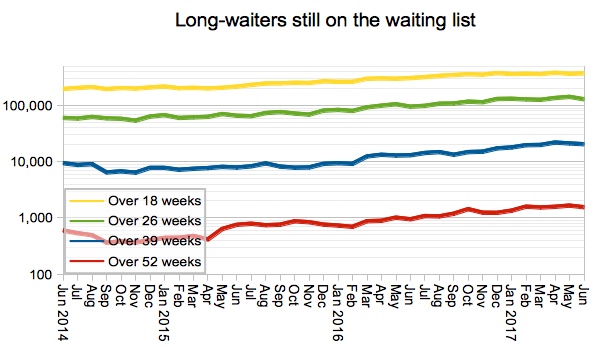
The number of one year waiters fell in June by 107 patients on the official figures, but this is entirely accounted for by The Royal Orthopaedic Hospital NHS Foundation Trust ceasing reporting and taking 108 one year waiters with them.
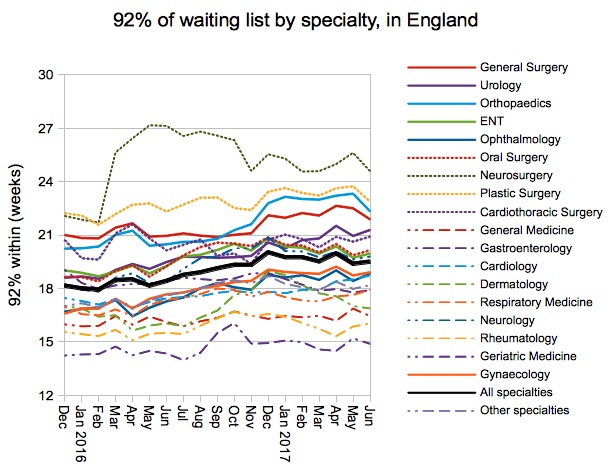
Looking at the various clinical specialties, there was a mixed picture with some specialties shortening their waiting times in June and some getting longer.
Local detail
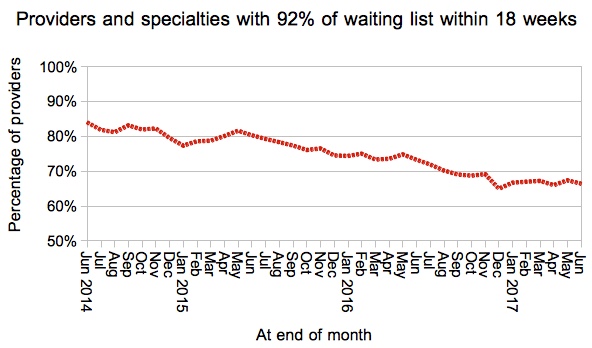
Looking at the data by specialty and by provider, the proportion of local services achieving the 18 week target eased downwards very slightly…
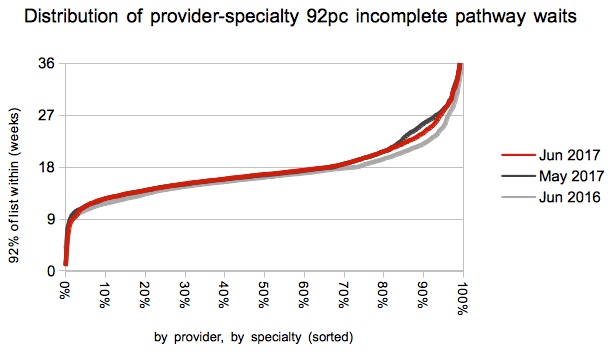
…as the distribution of waiting times erased the anomalous bulge that we saw in May, to reveal a more typical curve with waits rising fastest at the long-waiting end.
We’ve also done some interactive maps showing the waiting times position by specialty for every Trust and CCG with significant waiting lists. If you want to look your own Trust up quickly, then visit our 18-weeks reports page.
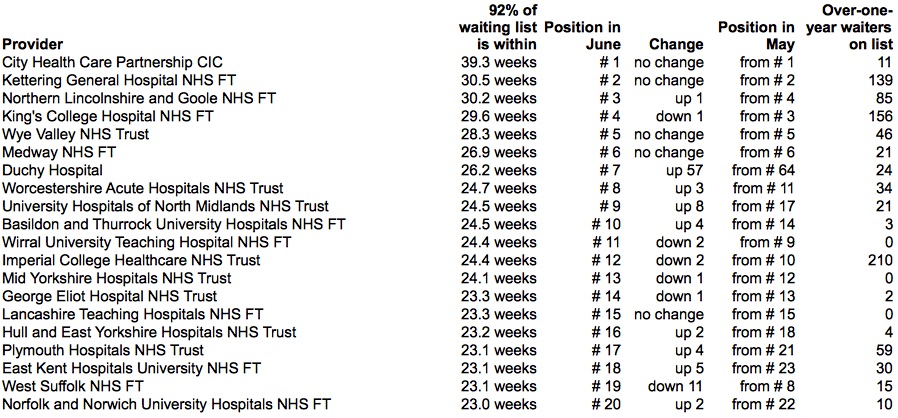
There was little change in the top twenty longest-waiting providers, barring a new entry from the independent sector provider Duchy Hospital who had some 24 one-year waiters on their list. They swapped places in June with independent sector provider New Hall Hospital, who went from 7th to 68th place and reduced their waiting times from 27.4 to 18.8 weeks.
The only other big mover on the table was West Suffolk NHS Foundation Trust, who have been experiencing data problems so hopefully this improved position is a sign that this is being sorted out.
Data for July 2017 is due out at 9:30am on Thursday 14th September.