

The elective waiting list in England remained below 4 million patients at the end of March, beating my forecast last year that this eye-catching threshold would be narrowly breached.
This will be a relief to the government because these were the last figures to be published before the general election, now that the official decision has been taken to slightly delay the next data release until the day after the election is held.
Actually elective waits fared quite reasonably this winter, unlike A&E, and the NHS managed to achieve the seasonal reduction in list size which usually happens in not-too-bad years.
But the reprieve is unlikely to last, as the waiting list continues its usual seasonal growth over the next few months. The 4 million mark may be passed in the April figures, and failing that it should be breached at the end of May. In case you are wondering, this will not be a new record – the very first month’s data from August 2007 showed a waiting list of 4,187,398.
March was a significant month for another reason, because the abolition of financial penalties for elective waiting times was announced shortly before the month ended. There wasn’t enough time for the change to affect the March figures, but we may start to see the effects from the April figures onwards.
As usual, in the following analysis, all figures come from NHS England. If you have a national statistic that you’d like to check up on, you can download our RTT waiting times fact checker.
England-wide picture
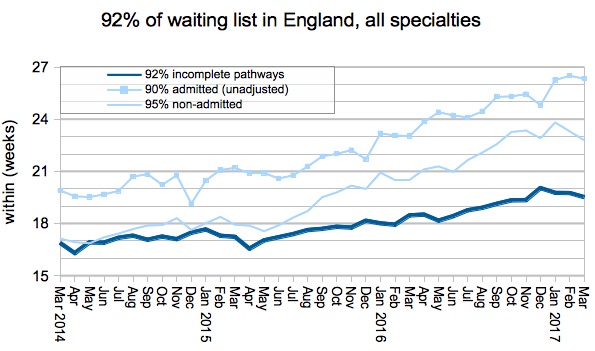
Waiting times improved slightly in March to 19.5 weeks, down from a peak of just over 20 weeks at New Year. That winter reduction is relatively good in this era of growing waiting lists, but compares badly with the winter improvements seen in the pre-2012 years when waiting lists and waiting times were coming down.
It is also worth noting that this seasonal improvement is no cause for comfort. The year-on-year trend remains firmly upward, and waiting times can be expected to rise again from May. Unless, that is, something big happens after the election that enables the NHS to keep up with elective demand again.
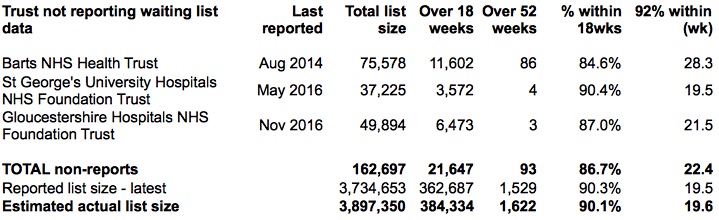
The (now thankfully quite short) list of non-reporting trusts is unchanged from February, so the reported March figures are directly comparable with February’s.
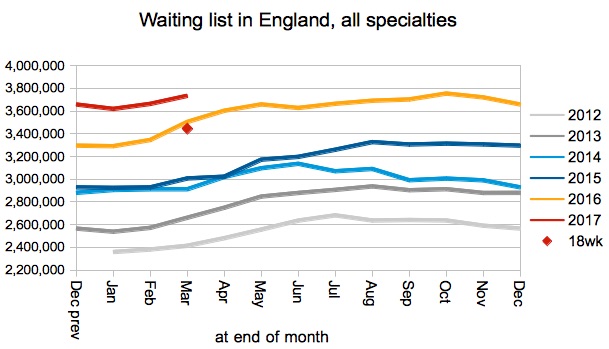
Returning to the as-reported figures, the chart below makes it look as if the waiting list grew more slowly this March than last. Unfortunately that is because last year’s figures were bolstered by two trusts resuming reporting. After taking that into account it turns out that this year’s March increase was slightly larger than last.
The sheer size of the waiting list is the main reason why waiting times are longer than 18 weeks, and the red dot in the chart below is an estimate of the list size that would allow 18 weeks to be achieved once again.
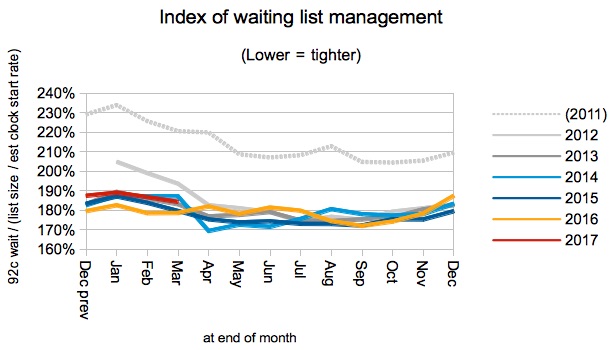
That red dot assumes that the shape of the national waiting list remains fairly steady; this measure is affected mainly by the order in which patients are treated, and the balance of resources between different services. The chart below shows that this index of waiting list management has remained steady since the “incomplete pathways” waiting time target was first met in 2012.
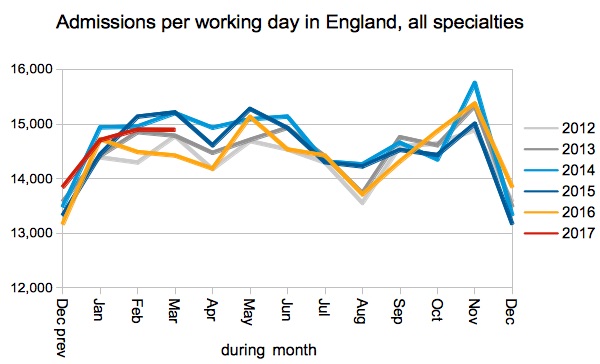
Admissions per working day are still following the seasonal trajectory of recent years, with no year-on-year increases to help the NHS keep up with rising demand.
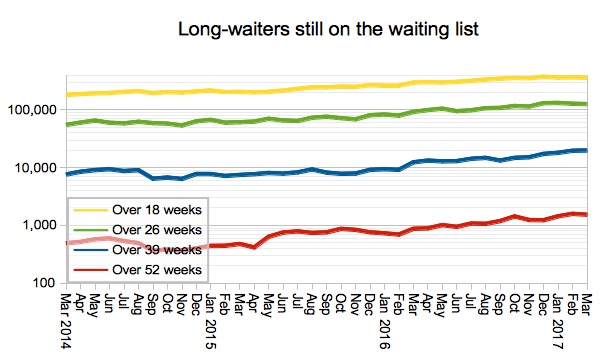
The number of long-waiters on the waiting list continues to creep up year-on-year, in line with the overall picture.
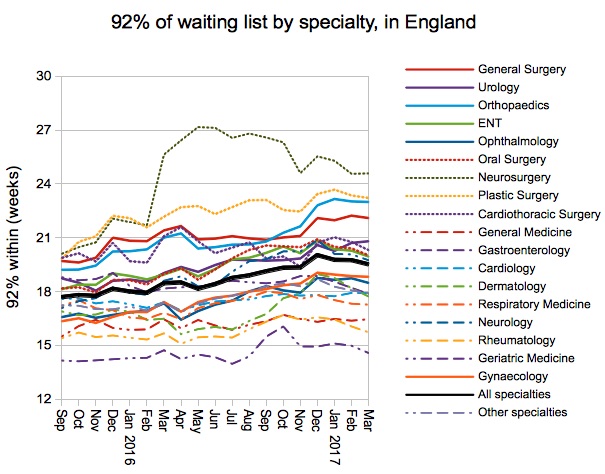
Three specialties squeezed back inside 18 weeks in March: Gastroenterology, Dermatology, and “Other specialties”. There was little change in most surgical specialties’ waiting times at national level.
Local detail
The proportion of local services (by specialty by trust) achieving the 18 week target remained steady.
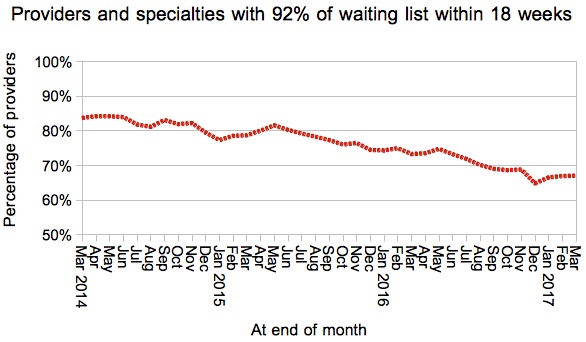
But here is a curious thing. In the chart below, which shows the waiting time achieved at each of thousands of local services, can you see the kink towards the left of the red line representing March 2017? There is also a kink in the March 2016 line, shown in grey. But the black line for February? No kink.
In fact there is no kink for any other calendar month in the last two years – it only appears for the end of March. My guess is that this is evidence of trusts having a final push to achieve 18 weeks on an all-specialties basis at the end of the financial year, and they find it easiest to do that by clearing over-18-week waiters in those specialties where waiting lists are already quite small.
If that is correct, then this is further evidence of the NHS managing to the target, not the needs of patients, otherwise the focus would be on tackling the longest waits instead. Now that financial penalties have been lifted from elective waiting times, this practice that can join the list of welcome opportunities to improve waiting list management that the abolition of penalties has opened up.

We’ve also done some interactive maps showing the waiting times position by specialty for every Trust and CCG with significant waiting lists. If you want to look your own Trust up quickly, then visit our 18-weeks reports page.
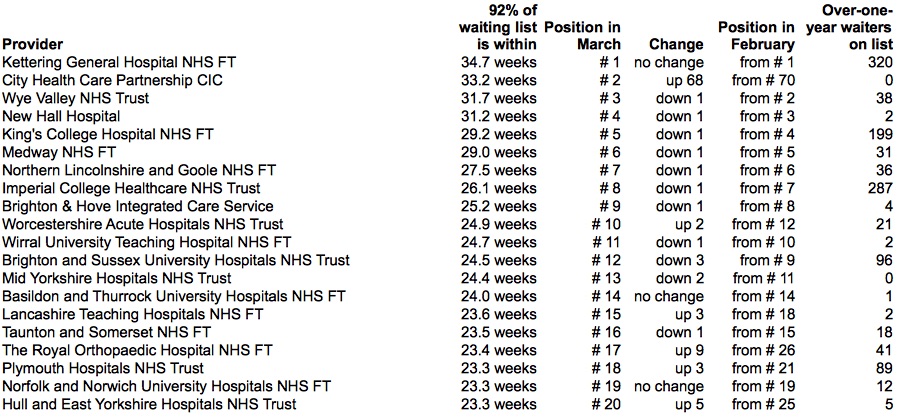
Kettering General Hospital NHS Foundation Trust only started reporting data again in February, and it is common for trusts in that position to land at the top of the long-waits table. Their Board papers lay out plans to improve performance, particularly on the important 52-week standard, and I wish them every success in delivering them.
I’m not sure what has happened at City Health Care Partnership CIC. Quite a few over 25 week waiters have appeared on their waiting lists (mostly under “Other” specialties) who were not there at the end of February.
Data for April 2017 is due out at 9:30am on 9th June (delayed by one day until the day after the general election).