

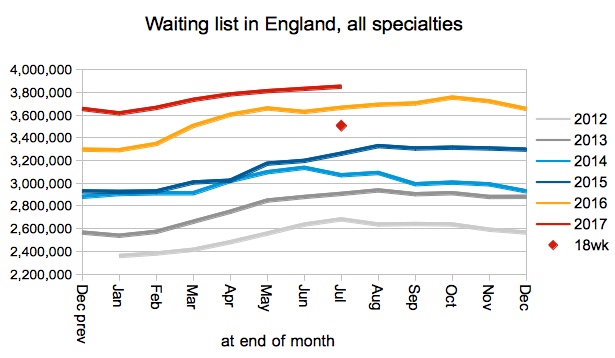
For the second month running, more than 4 million patients were waiting for consultant-led elective care across England (after adjusting for non-reporting trusts).
A longer queue means longer waits, so it is no surprise that waiting times continued to breach the target for the 17th month running. The rules say that 92 per cent of the waiting list should be within 18 weeks, but at the end of July it was out at nearly 20 weeks.
Next month’s figures will mark 10 years since the first referral-to-treatment waiting list data was collected in 2007, when there were 4,187,398 patients on the waiting list. A massive push to cut waiting times reduced it to 2,303,305 in January 2009, where it stabilised for a few years before rising again after 2012 to over 4 million today.
Will it rise above its starting point for the 10th anniversary? I’d say it’s unlikely, though it will be getting close.
In the following analysis, all figures come from NHS England. If you have a national statistic that you’d like to check up on, you can download our RTT waiting times fact checker. And with that, let’s turn to the detailed analysis.
England-wide picture
Waiting times remain well above the 18 week target, and although the long term trend is up there has been little movement since December. Is this cause for hope?
I would suggest not. It is true that waiting times at the end of July were fairly close to their position at Christmas, but that has been the usual pattern since 2012 (apart from last year). If the pattern continues then we would expect waiting times to rise by about another half a week between now and New Year.
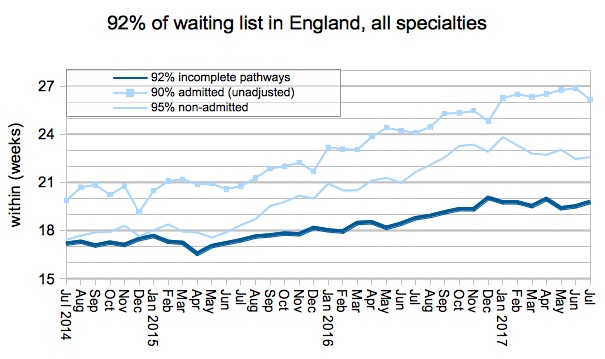
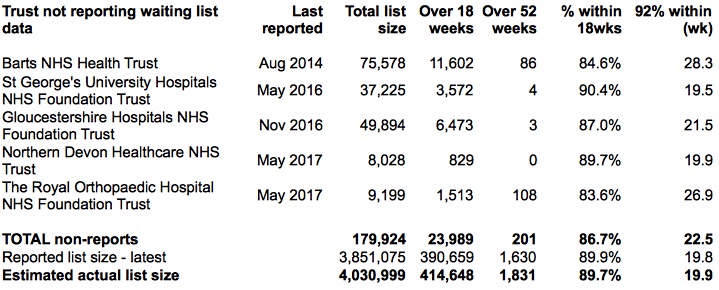
All the charts in this analysis are based on the published statistics, but the table below shows how those figures would be different if non-reporting trusts were factored in. After adding in the last known positions at missing trusts, the waiting list is just over 4 million and waiting times are barely below 20 weeks.
The waiting list continues to grow year-on-year, and this is the main reason why waiting times are continuing to rise.
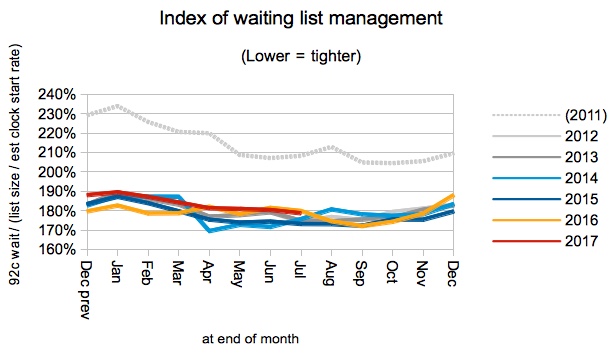
However waiting times don’t just depend on the size of the waiting list; they also depend on the order in which patients are treated. The chart below shows how this has remained stable since the current waiting times target was introduced in 2012.
The size of the waiting list is the accumulated mismatch between demand and activity. If the NHS keeps up with demand then the waiting list remains a constant size. If it falls behind demand (as is happening at the moment) then the waiting list grows.
Unfortunately measuring all of this is somewhat tricky. Not all referrals result in treatment, and many of those un-treated discharges are included in the count of “non-admitted” patients. This clouds both the picture of demand and activity.
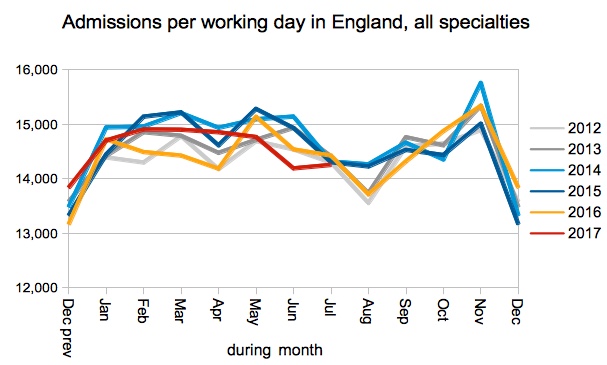
On the other hand, the count of patients who are admitted as inpatients and daycases definitely represents a major part of the effort to treat patients, and that is why I use it to illustrate what is happening to activity. So, against a backdrop of rising demand, the next chart shows that admissions per working day are not rising and instead remain at the same level as in recent years.
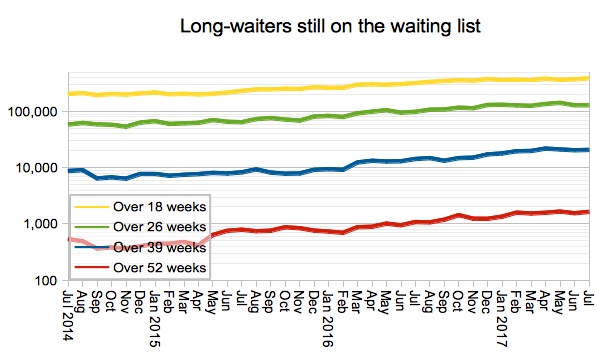
In human terms, it is the extreme waiting times that make the biggest difference to patients. There were 1,630 one-year waiters on the waiting list at the end of July, which is back to where things were in 2012. By contrast, the best performance was in November 2013 when just 214 patients were waiting over a year.
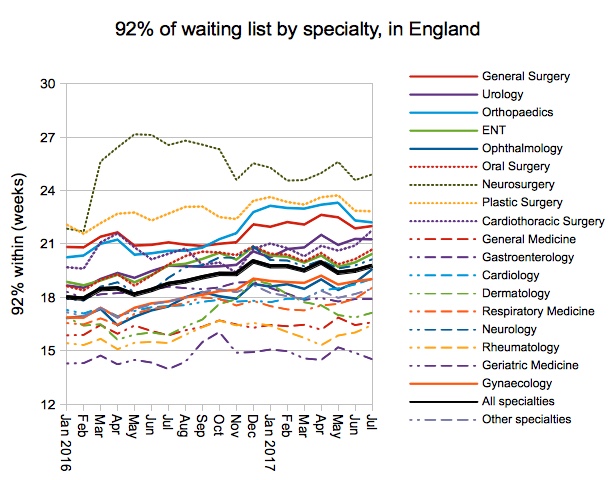
Looking at specialty level, only 5 of the 19 individual specialties in the referral-to-treatment statistics remain within 18 weeks at national level. Orthopaedics is the longest-waiting big surgical specialty, although General Surgery is not far behind.
Local detail
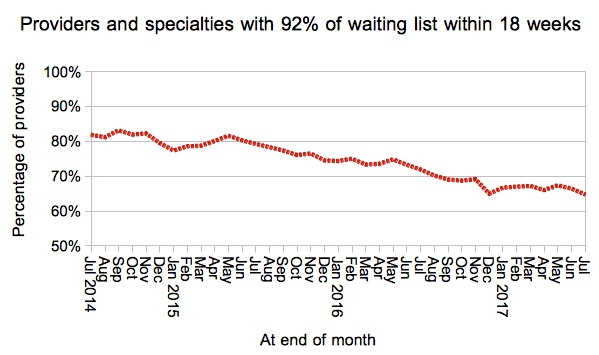
Turning now to the picture at local level, the proportion of local services (by specialty, by provider) achieving 18 weeks has resumed its worsening trend, reaching a new low of just 64.7 per cent. If you manage a local specialty that is breaching 18 weeks then you are not alone.
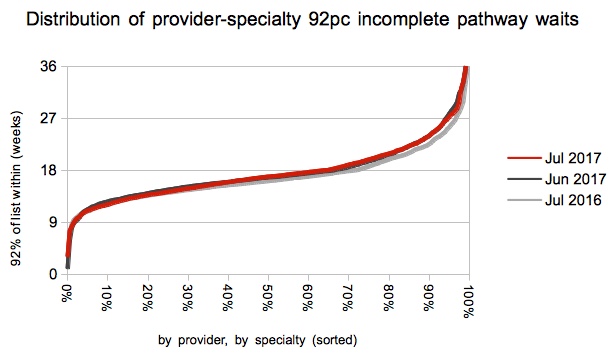
Looking at the distribution of waiting times across local services, those that already had shorter waits improved slightly in July, while those close to or above 18 weeks got slightly worse.
We’ve also done some interactive maps showing the waiting times position by specialty for every Trust and CCG with significant waiting lists. If you want to look your own Trust up quickly, then visit our 18-weeks reports page.
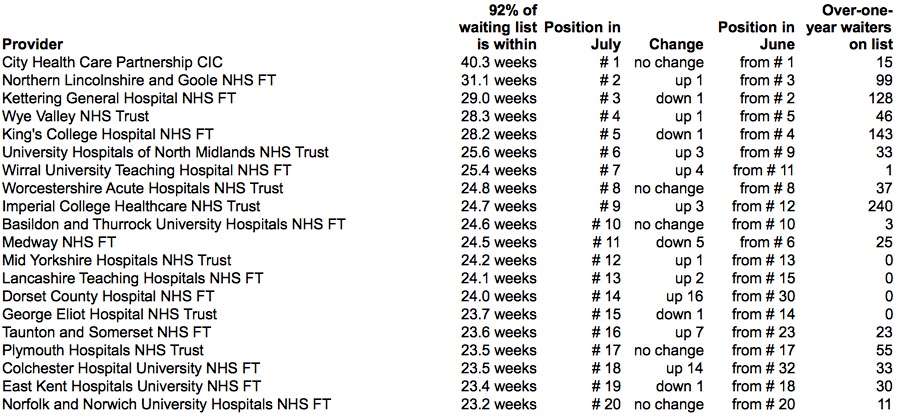
There was little movement in the top twenty longest waiting providers in July, apart from Dorset County Hospital NHS Foundation Trust and Colchester Hospital University NHS Foundation Trust who have risen 16 and 14 places respectively to appear in the latest table.
Data for August 2017, the 10th anniversary of the first referral-to-treatment data on incomplete pathways, is due out at 9:30am on Thursday 12th October.