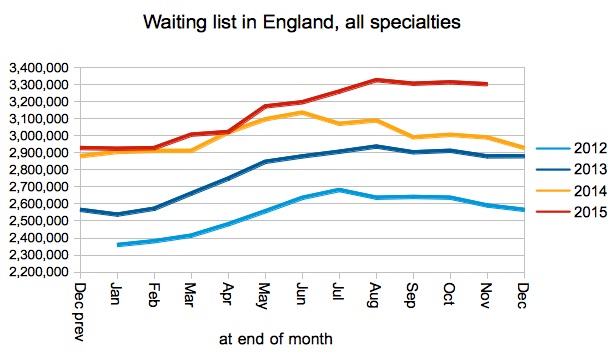
The English waiting list grew by nearly 300,000 patients, or 7.3 per cent, from February 2018 to February 2019, according to statistics which adjust for non-reporting trusts released by NHS England and NHS Improvement. On an unadjusted basis the reported increase is even worse at over 10 per cent.
This is a blow to the planning guidance for 2018-19 which said:
A more significant annual increase in the number of elective procedures compared with recent years means commissioners and providers should plan on the basis that their RTT waiting list, measured as the number of patients on an incomplete pathway, will be no higher in March 2019 than in March 2018 and, where possible, they should aim for it to be reduced.
The number of one year waiters continued to improve during February and is lower year-on-year, though not low enough to deliver the planning guidance’s ambition that numbers should halve in 2018-19.
For analysis of waiting times performance at a particular organisation, visit our reports page. You can also access maps of the latest waiting times across England for A&E, cancer, and RTT.
In the following discussion, all figures come from NHS England and NHS Improvement. If you have a national statistic that you’d like to check up on, you can download our RTT waiting times fact checker
England-wide picture
Waiting times became shorter during February, on both the officially-reported figures and those adjusted for non-reporting trusts. This is good news though not unusual for the time of year.
Taking a longer perspective, English waiting times rose by about 5 days over the previous 12 months, which is less brisk than the previous two years but still solidly in the wrong direction.
The officially reported list sizes are heavily affected by the Royal Free London NHS Foundation Trust dropping out of the data and taking its long waits with it.
Returning to the reported figures, the apparent slight shrinkage in the waiting list is an artefact of the Royal Free dropping out of the data, and in fact the waiting list grew by an estimated 47,000 patients which is typical of recent Februaries.
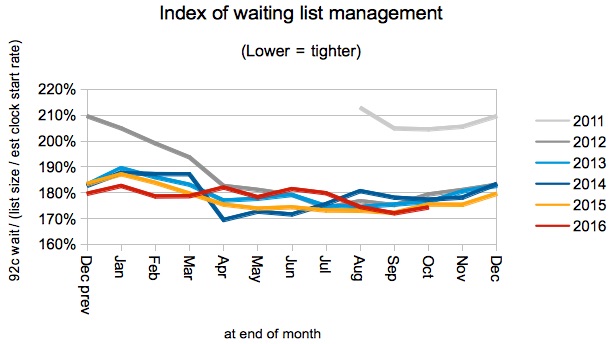
The index of waiting list management, which combines all the influences on waiting times other than the size of the waiting list, remained at the higher (i.e. worse) level seen in recent months.
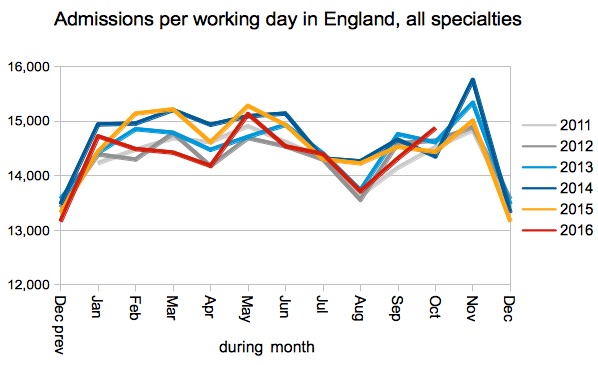
Admissions per working day were better than last year, when there was a blanket elective shutdown to create winter capacity for non-elective patients, but still poor compared with previous years. This means there is little evidence so far of the extra surgical activity promised in the Long Term Plan and (as quoted above) in the 2018-19 planning guidance.
One year waits continue to provide a silver lining to the gloomy overall picture. Although the Royal Free’s absence has helped this indicator to fall, the reduction in one year waiters was real. This is an important metric – nobody should have to wait a year – and the continued emphasis being placed on this is welcome.
Individual specialties reflected the overall improvement in waiting times in February.
Local detail
The proportion of local services achieving ’18 weeks’ also improved slightly in line with the overall position.
The improvement in local waiting times during February was fairly evenly spread across all waiting times.
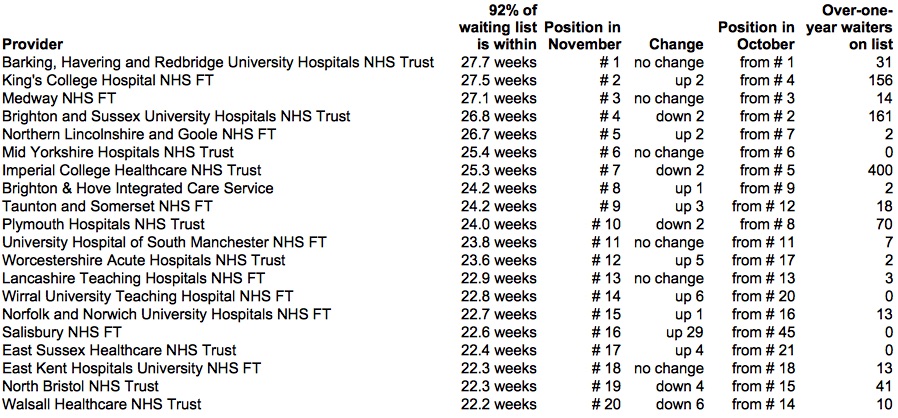
Two independent sector providers have bounded into the top twenty list of longest-waiting providers this month. I am not familiar with either, but St Hugh’s Hospital is in Grimsby so would guess that they are catching overspill from Northern Lincolnshire and Goole NHS Foundation Trust, and similarly that Mount Stuart Hospital is catching overspill from nearby Torbay and South Devon NHS Foundation Trust.
Referral-to-treatment data for March, which marks the end of 2018-19, is due out at 9:30am on Thursday 9th May. This data will also see revisions to the historic data from October 2017 to September 2018.


