

The English referral-to-treatment (RTT) waiting list shrank by a reported 50,000 patient pathways in the 12 months to July, according to the latest figures. The last time it shrank was November 2020 in the tail-end of the covid shutdowns.
Analysis produced for Health Service Journal by Dr Rob Findlay, Director of Strategic Solutions at Insource Ltd and founder of Gooroo Ltd
Nearly all (about 43,000) of the reduction is not real, and was caused by the removal of community service waiting lists in February, and also some was caused by a major mental health trust dropping out of the data at about the same time. But that still (probably) leaves a small year-on-year fall in the reported wait list that is worth cheering.
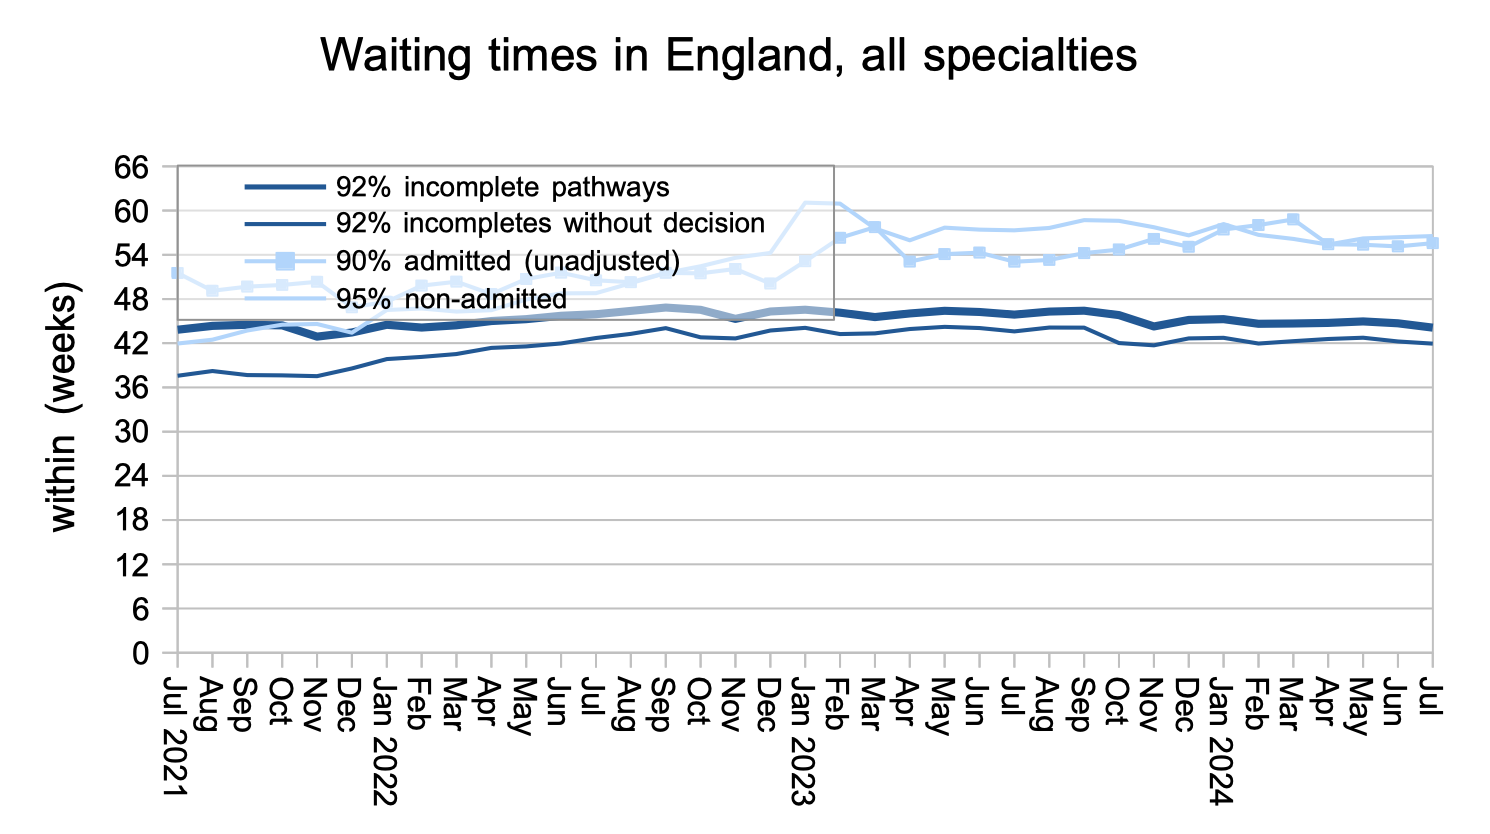
Waiting times fell during July from 44.7 to 44.1 weeks RTT. Waiting times from referral to diagnosis and decision to admit also fell, from 42.2 to 41.9 weeks, but this remains far too long if you are one of the estimated 27,902 patients whose eventual diagnosis will be a hitherto unsuspected cancer.
The elephant in the room is overdue follow-ups and other overdue ‘planned’ patients such as active monitoring. According to the RTT rules (Chapter 5 here) these overdue patients should be reported in the RTT figures, but most trusts do not adhere to this rule and many struggle even to count them. The numbers are potentially large enough to make the government’s pledge to restore the 18 week waiting time standard by 2029 impossible. We need to start counting and tracking these patients. They are time limited and delays to their care constitute a clinical risk.
In the following discussion, all figures come from NHS England. You can look up your trust and its prospects for achieving the waiting time targets here.
The numbers
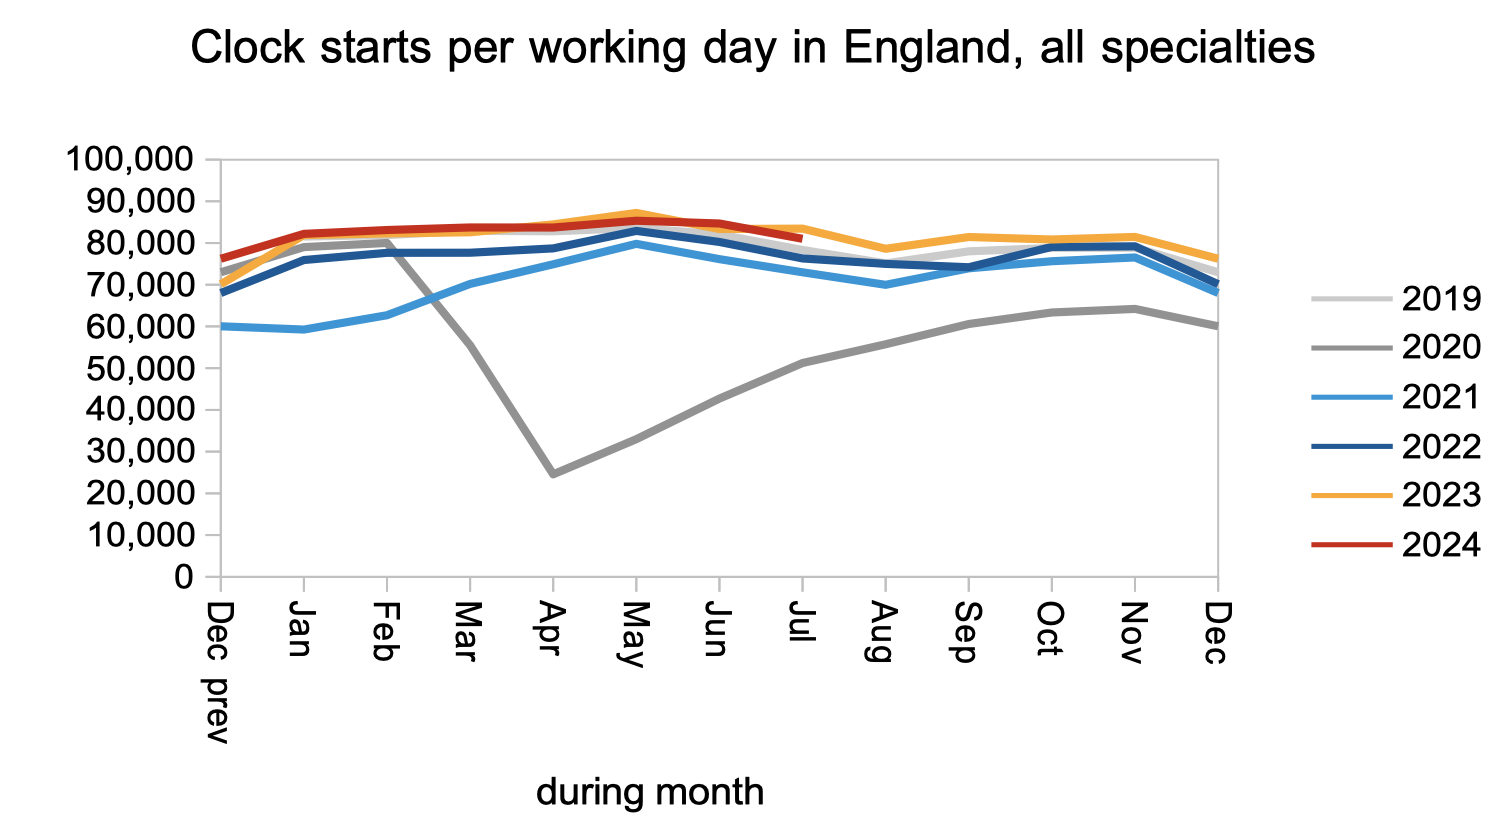
The demand for elective care, measured by the number of patients starting new waiting time ‘clocks’ dipped as the holiday season got underway.
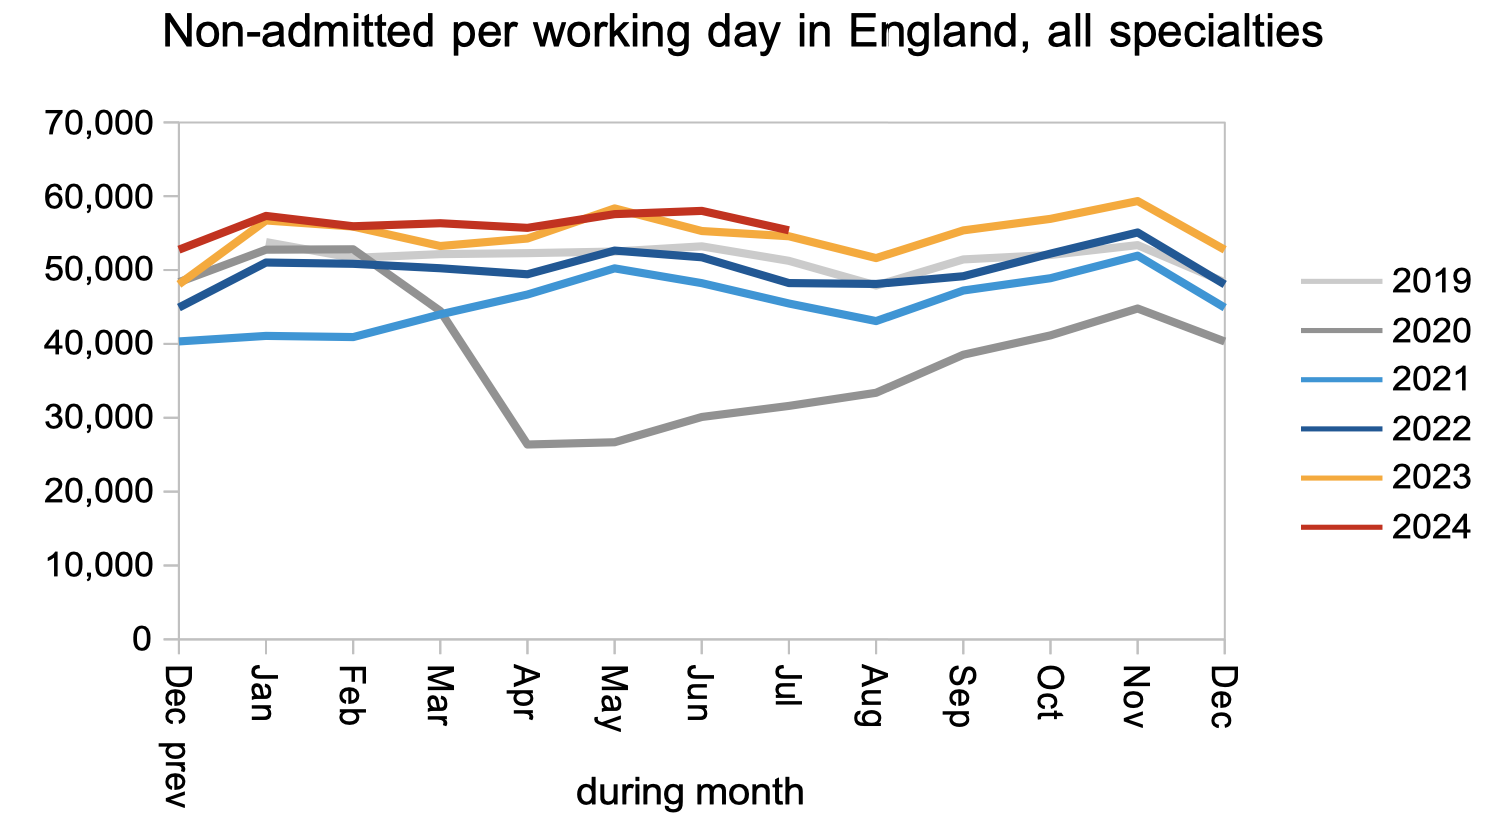
Patients left the waiting list following an outpatient appointment, or administratively, at the same rate as last year.
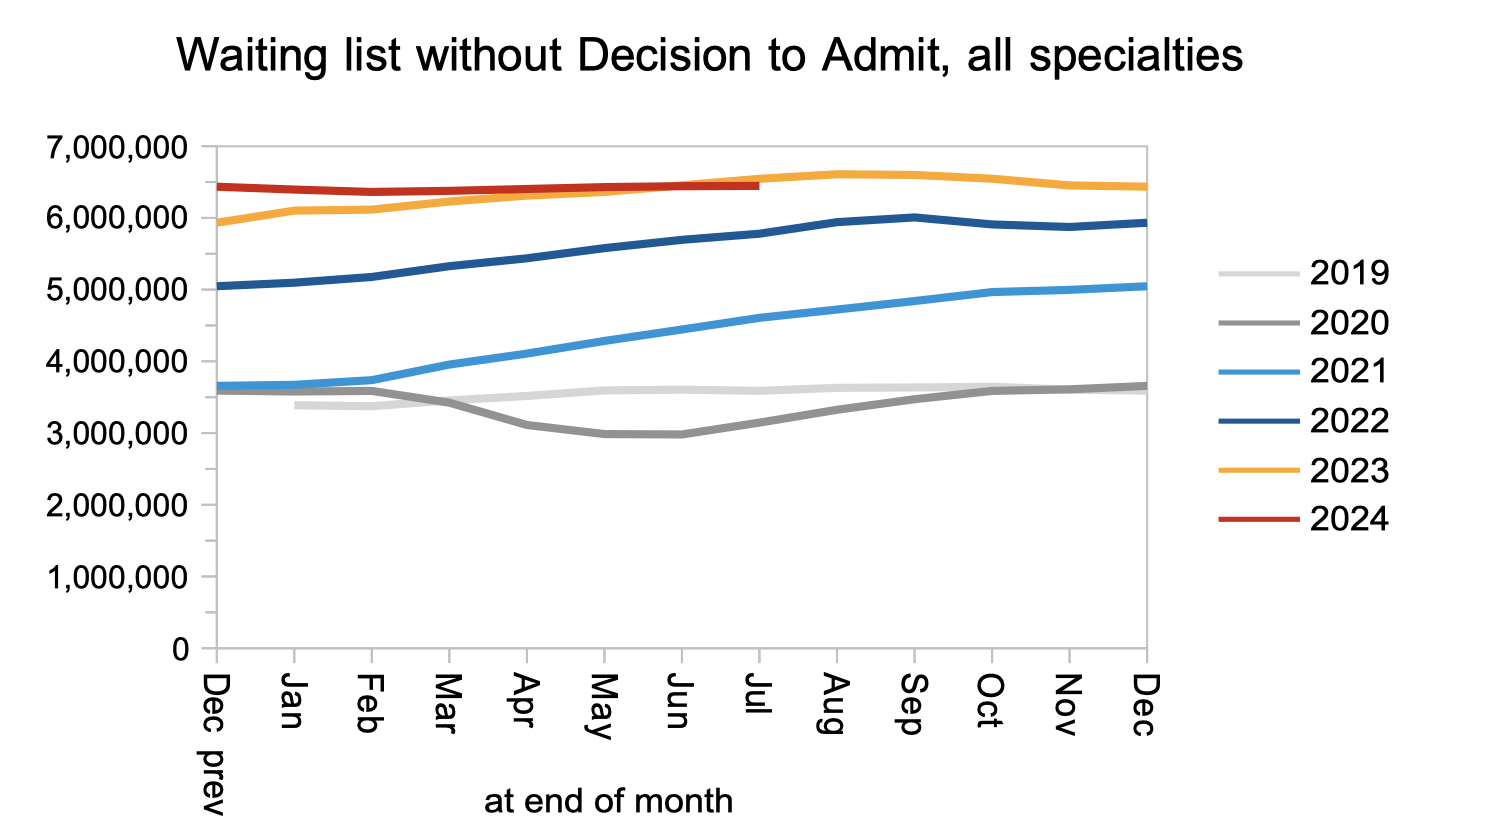
The net result of those referrals and discharges, together with patients moving on to wait for admission, was that the waiting list for diagnosis and decision (which is most of the total waiting list) remained static in July.
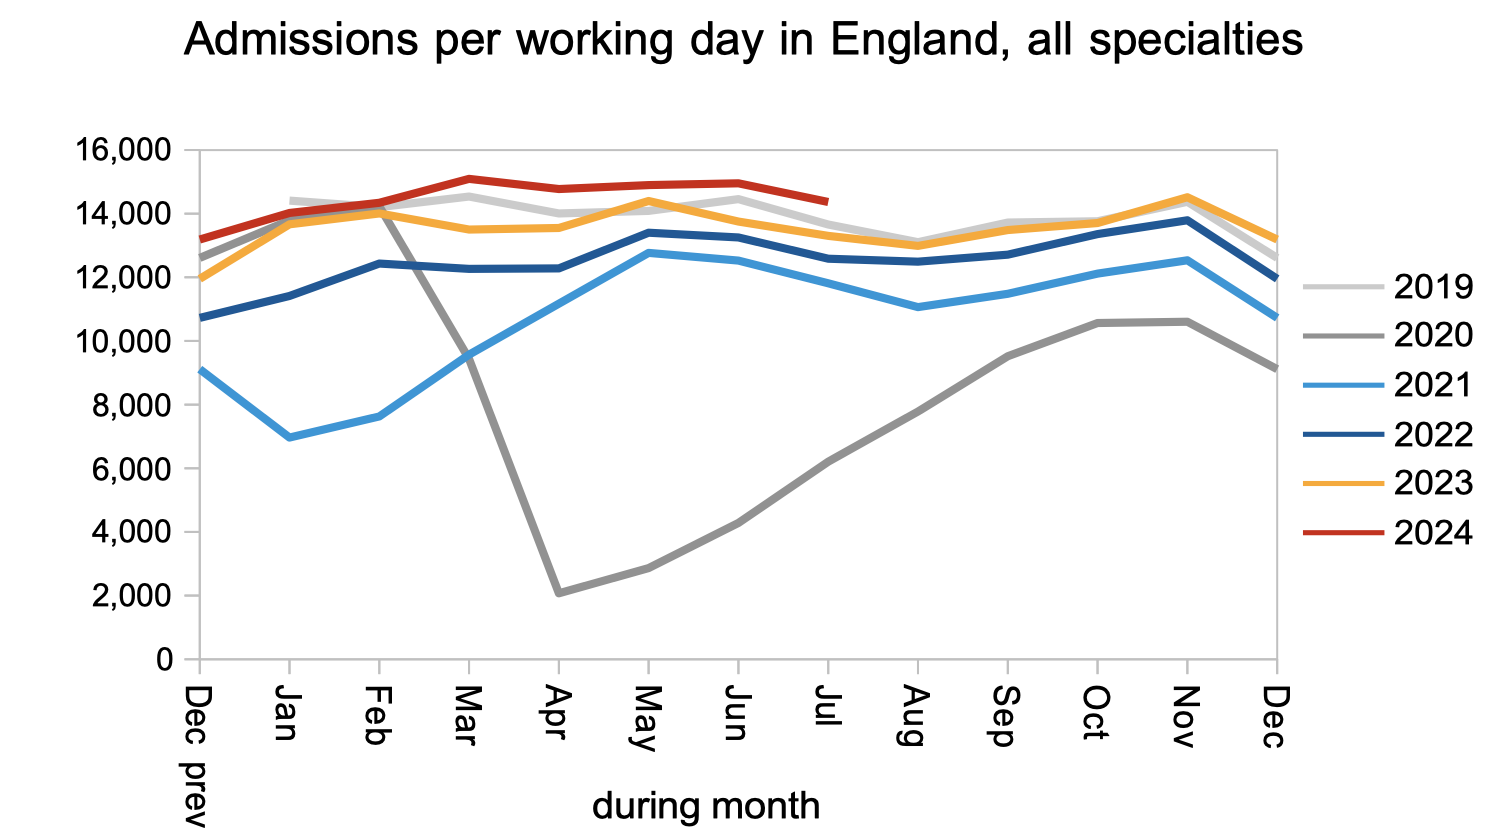
Patients were admitted for inpatient and daycase treatment at a higher rate than pre-pandemic.
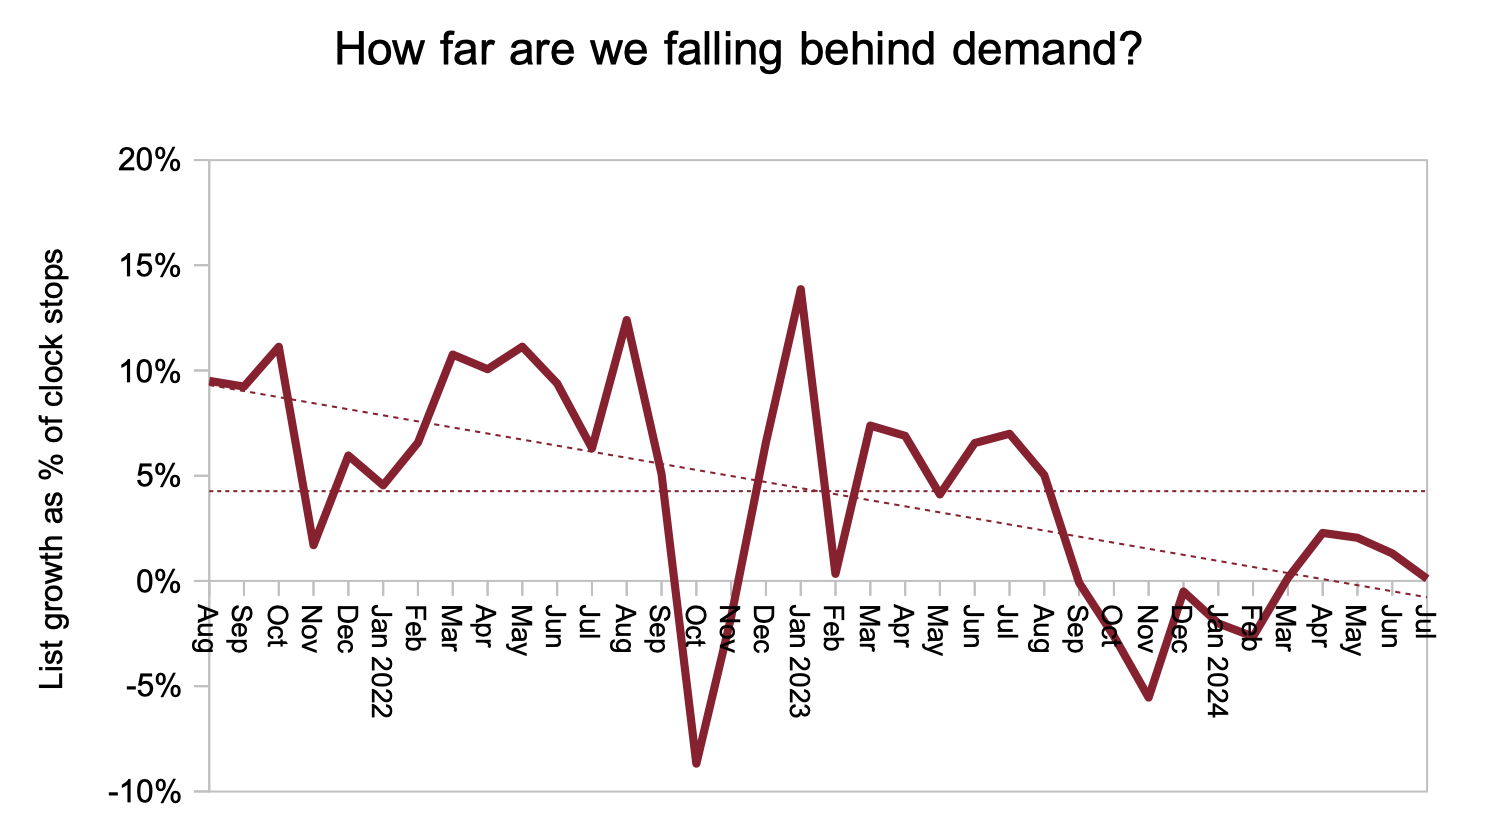
The net result of all those referrals, removals, and treatments was a static waiting list that is slightly below the previous year’s line. As noted above, this is the first time since the pandemic that the waiting list has (probably) fallen year-on-year. But it needs to fall much, much faster to get down to a size where the 18 week RTT standard can be achieved by 2029. We also know that these waiting list numbers are not complete because large numbers of overdue follow-up and other ‘planned’ patients are not being reported when they should be.
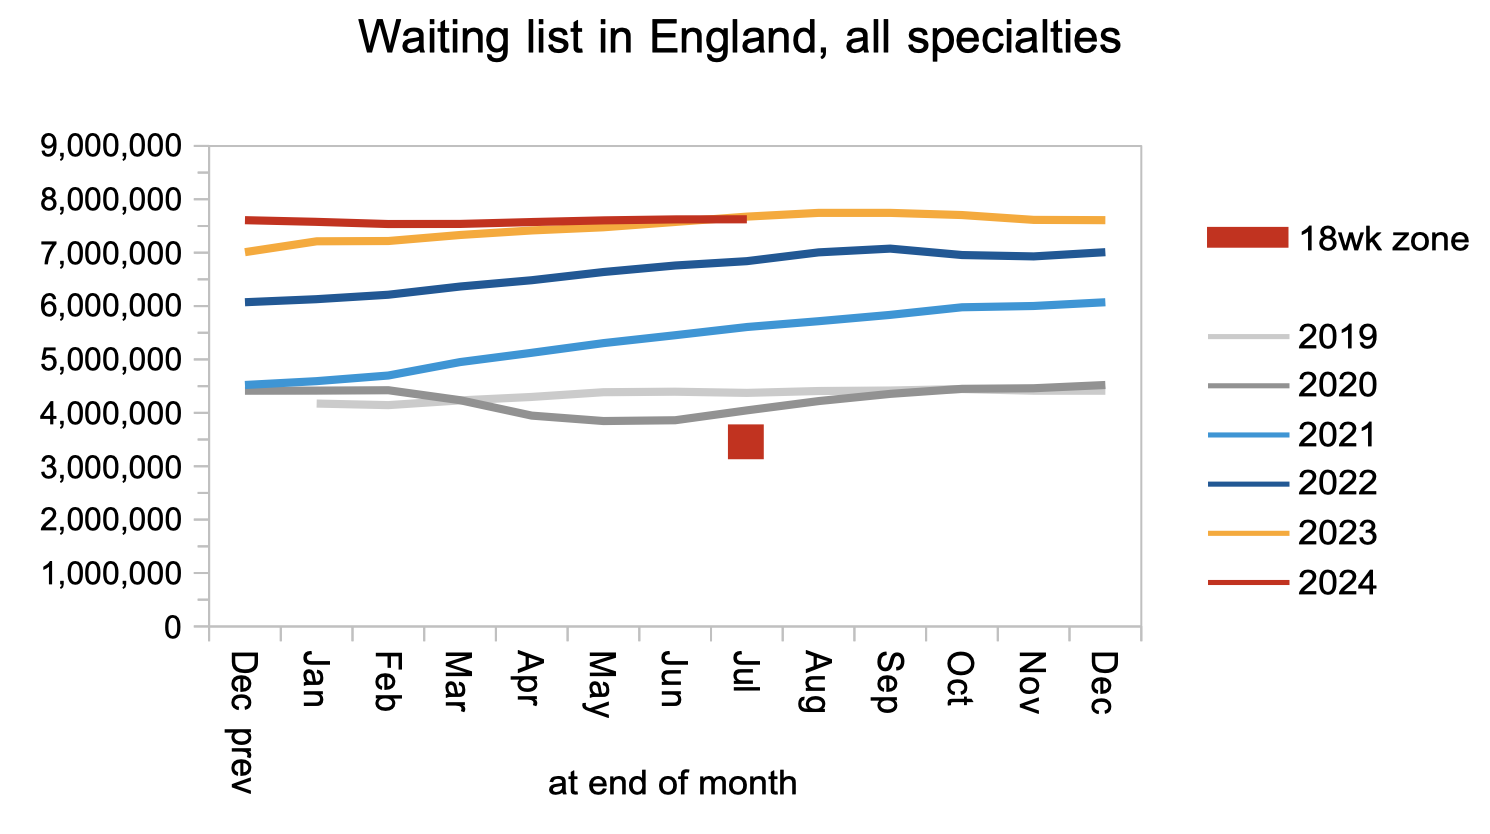
The waiting list is no longer growing, which means the NHS in England is broadly keeping up with (reported) demand. So at a broad national level, restoring the 18 weeks standard is now a non-recurring problem. At local level, however, there remain large variations in recurring and non-recurring pressures that will need to be addressed when targeting resources accurately.
Waiting times, which are what matter to patients, fell during July.
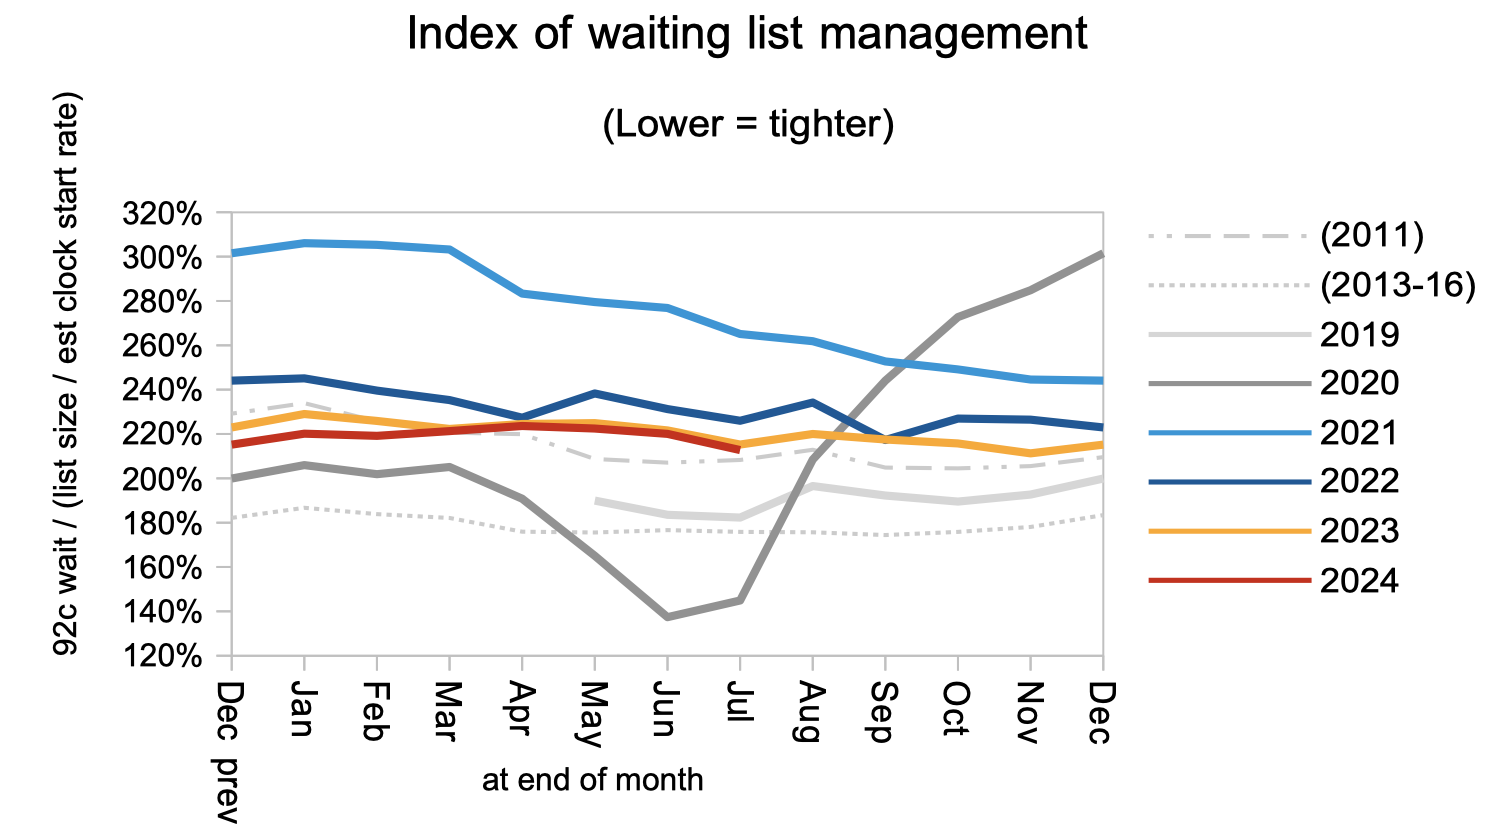
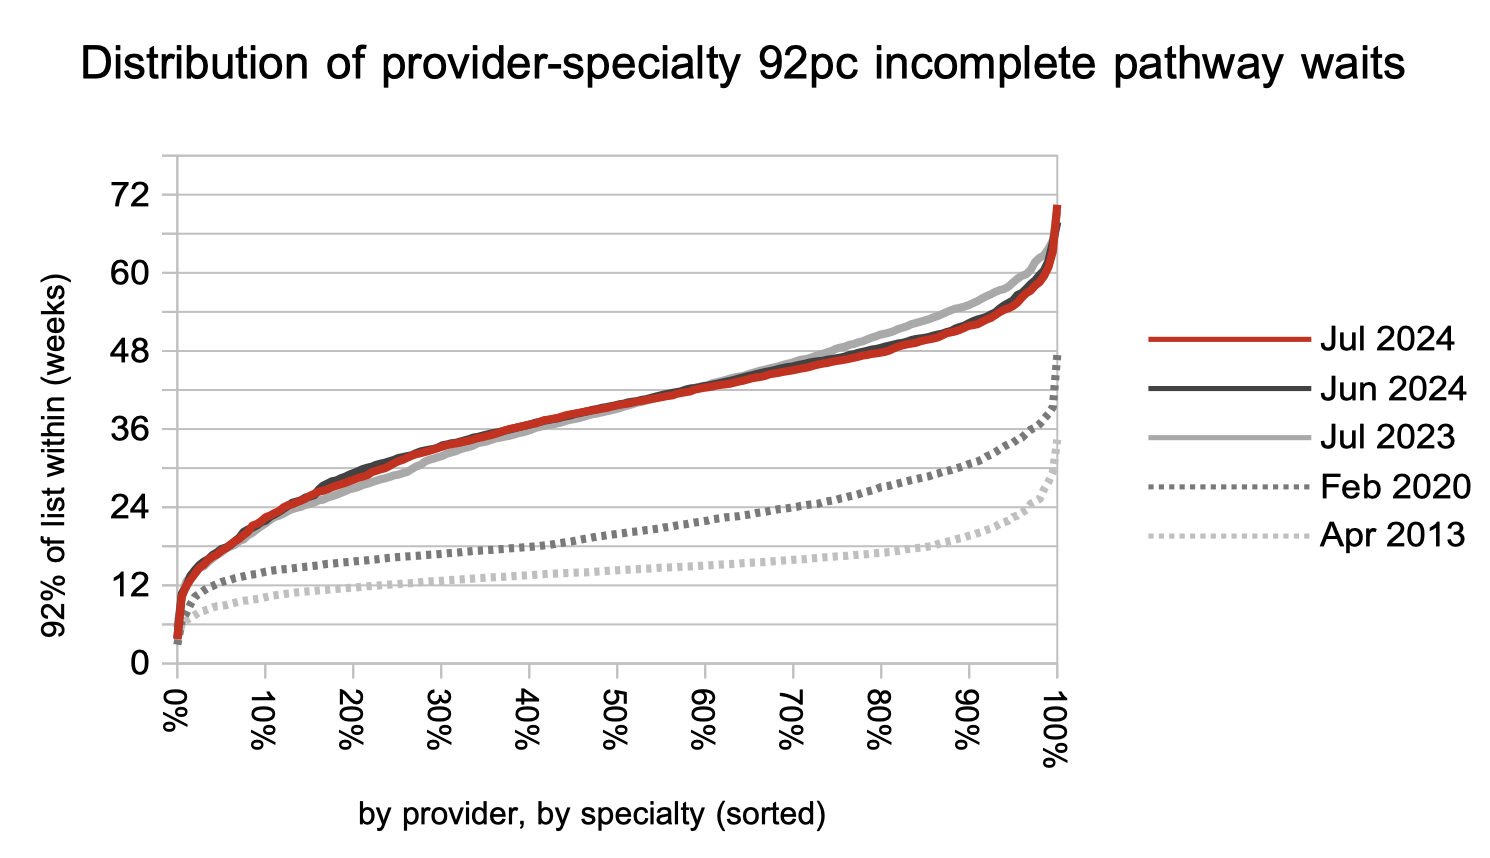
Waiting times are a function of both the size and shape of the waiting list, and the shape is represented below. It remains worse than in 2011, which was the last year before the sharp improvement caused by the introduction of the current 92 per cent incomplete pathways target. The current poor shape is largely explained by large variations in waiting time pressures between services across the country.
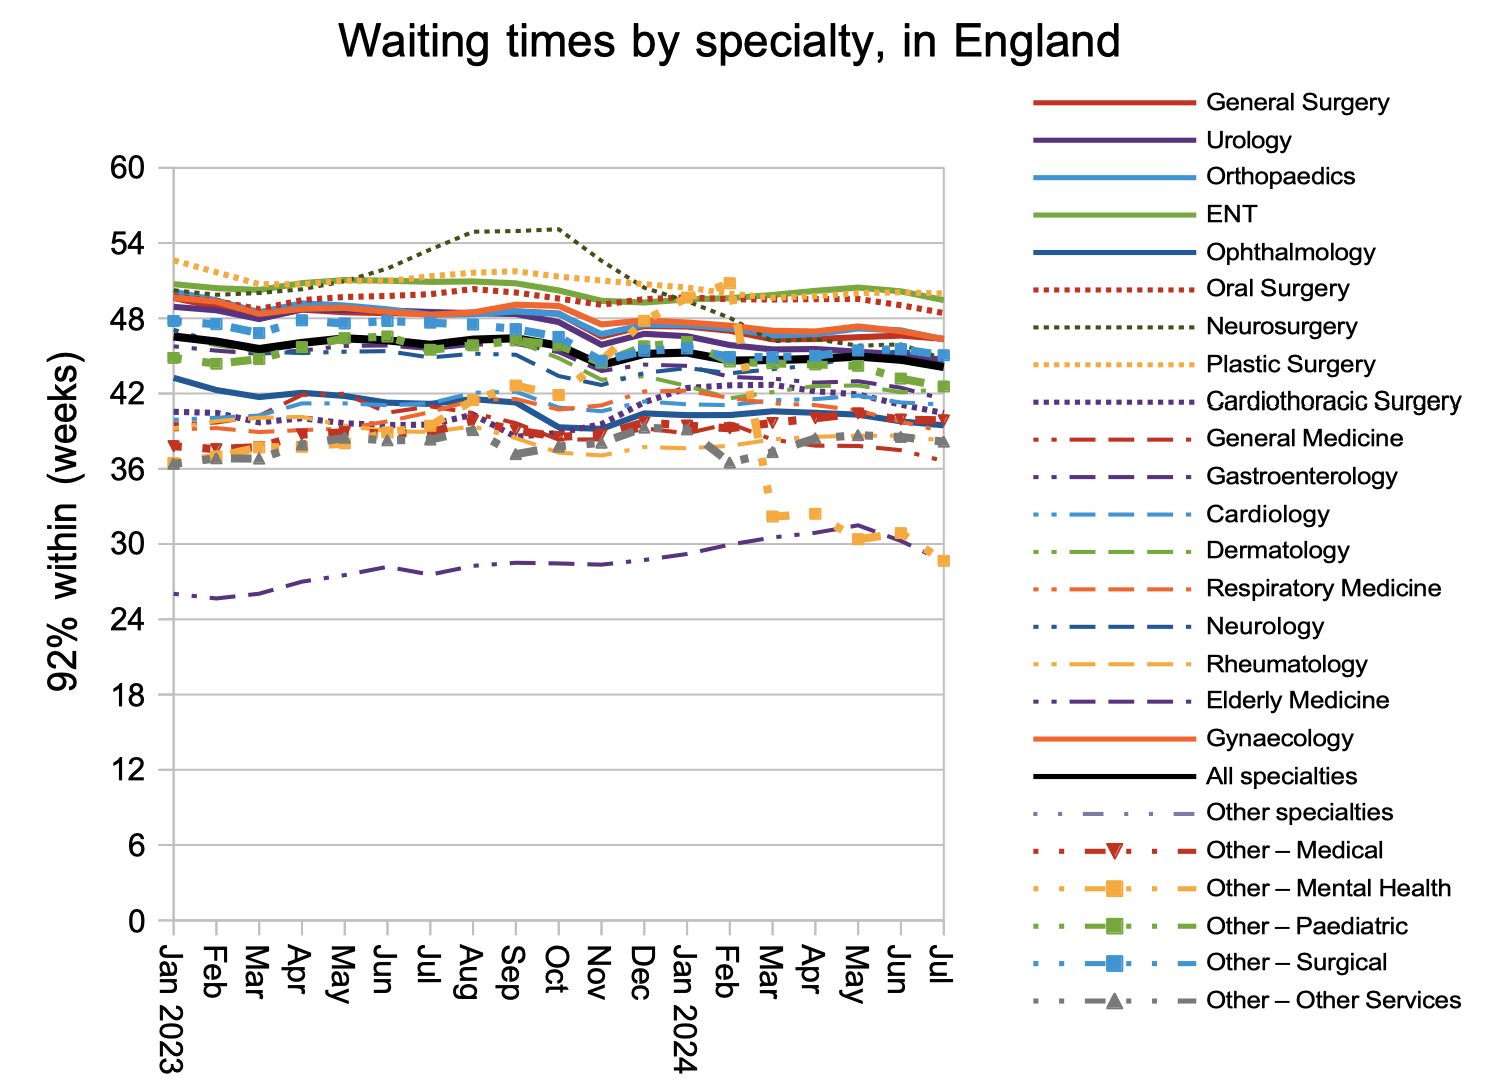
At specialty level, plastic surgery has edged past ENT to become the longest waiting specialty nationally. The sharp drop in mental health waiting times earlier this year was caused by a major trust dropping out of RTT reporting; it is possible that this omission together with community services might almost exactly explain the year-on-year reduction in the national waiting list size noted above, but as it’s a close run thing I have given the figures the benefit of the doubt and called it a genuine small fall.
Looking at the thousands of local services across England, the distribution of waiting times shows that little has changed for patients at most local services, with a welcome improvement for those in the longest-waiting local specialties.
Referral-to-treatment data up to the end of August is due out at 9:30am on Thursday 10th October.