

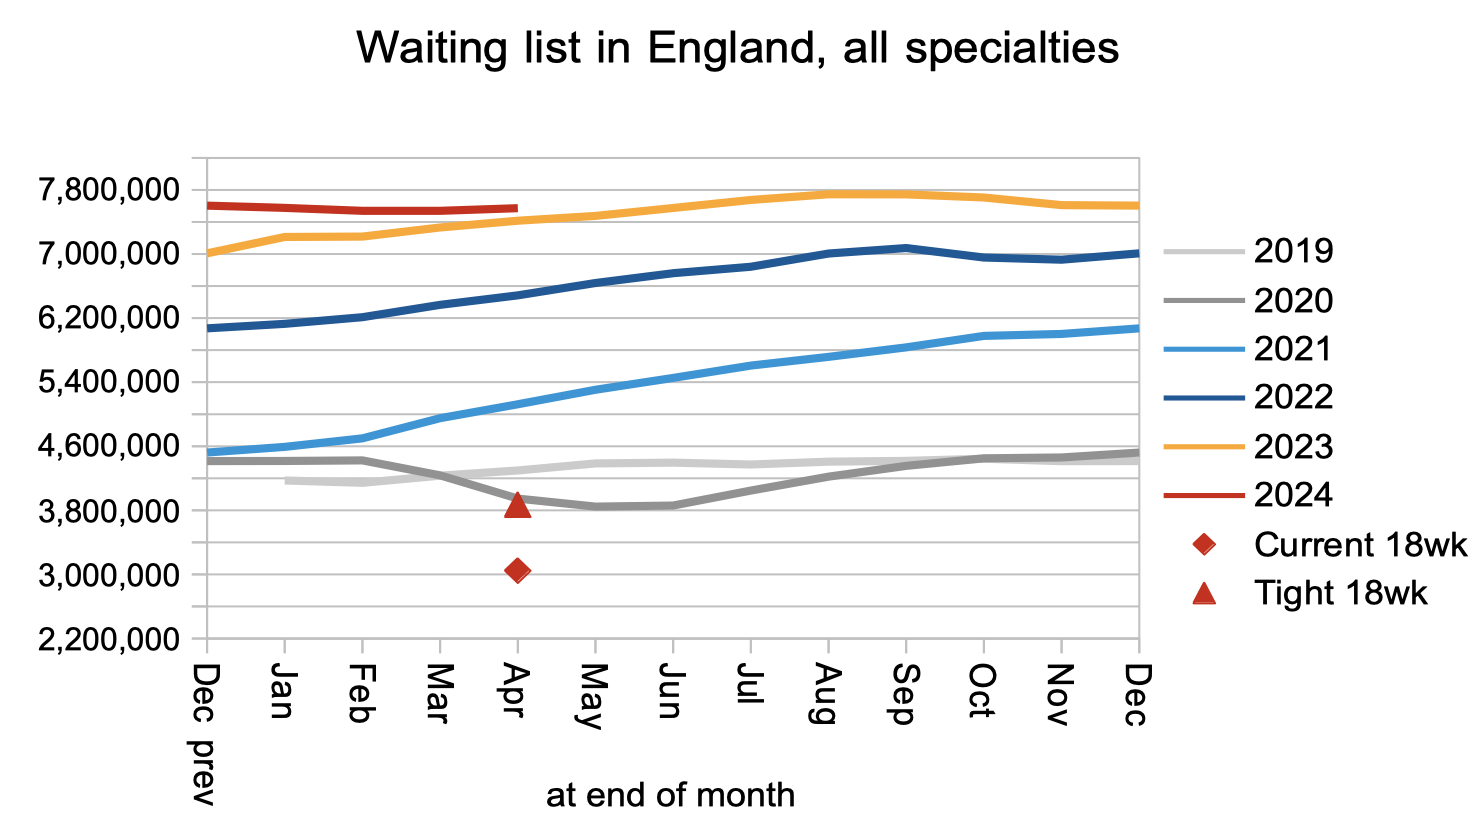
In April the English referral-to-treatment (RTT) waiting list grew slightly by 34,000 to 7.57 million patient pathways. These are the last figures to be published before the general election, meaning that the pre-election waiting list is 358,000 larger than the figures available when Prime Minister Rishi Sunak said “NHS waiting lists will fall”.
Analysis produced for Health Service Journal by Dr Rob Findlay, Director of Strategic Solutions at Insource Ltd and founder of Gooroo Ltd
The current crop of waiting time targets went in the wrong direction too. The NHS should have eliminated 104 week waiters by July 2022, but the number increased by 43 to 275 in April. Likewise 78 week waiters should have been eliminated by April 2023, but increased by 243 to 5,013. And the next target to eliminate 65 week waiters by September 2024, recently pushed back from March, moved further out of reach with numbers increasing by 1,429 to 50,397.
Is there any glimmer of light for the current Prime Minister? Indeed there is. He also promised that “people will get the care they need more quickly”, and the typical routine waiting time has actually fallen from 46.5 to 44.8 weeks since he made the promise (although it has been rising again slowly since February).
All these targets are (I hope) about to be moot because both Conservative and Labour parties have pledged to restore the statutory 18 week standard – an ambition of sufficient scale to supersede the current efforts at the margins.
In the following discussion, all figures come from NHS England. You can look up your trust and its prospects for achieving the current waiting time targets here.
The numbers
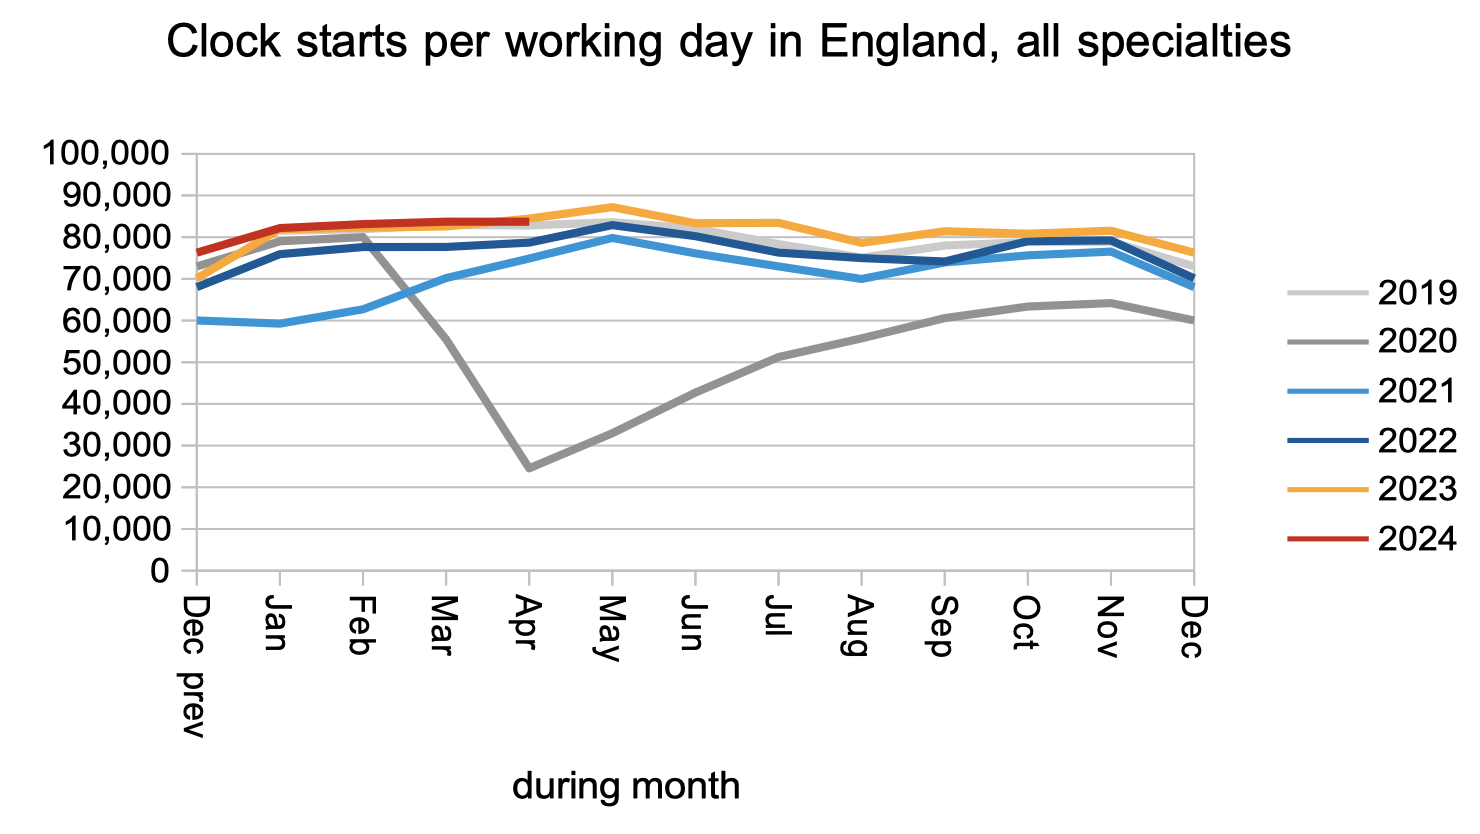
The demand for elective care, measured as the number of patients starting new waiting time ‘clocks’, remained at pre-pandemic levels.
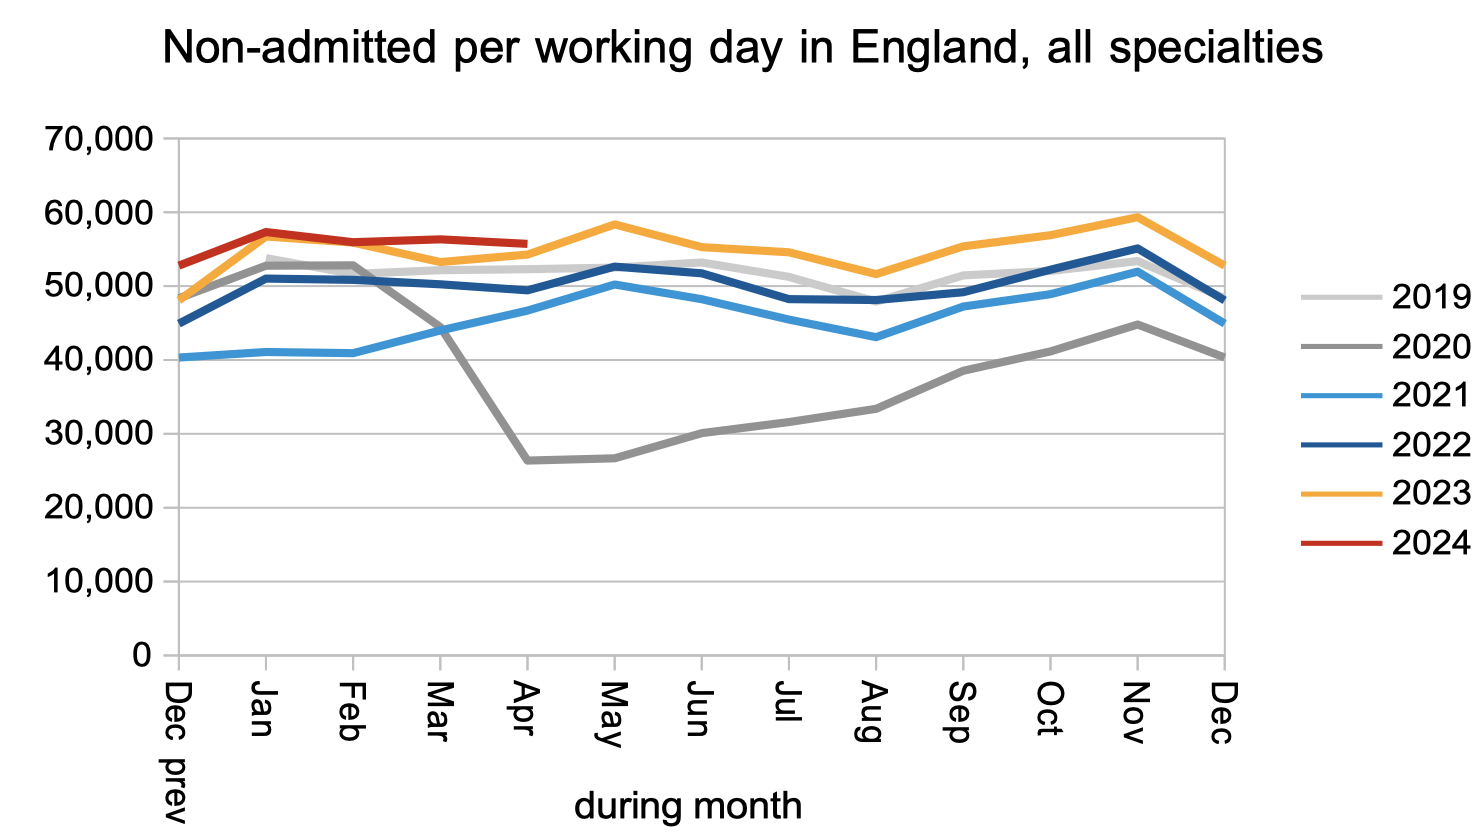
Patients ended their wait for reasons other than admission (mostly in outpatients and diagnostics) at above pre-pandemic levels.
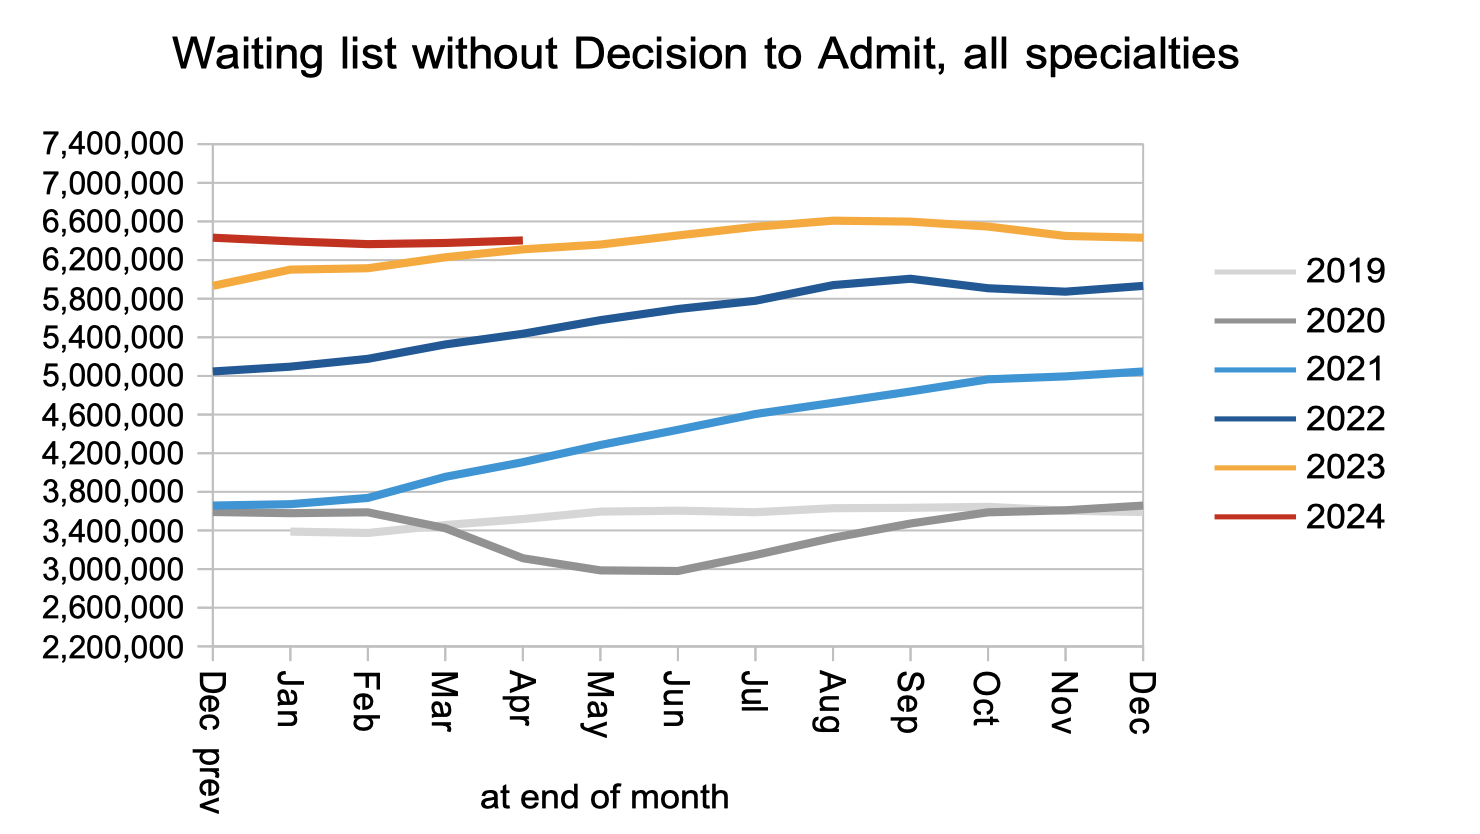
The net result of that, plus those converting to the admitted care waiting list, was that the outpatient/diagnostic waiting list grew slightly by 27,000 to 6.40 million (which is most of the RTT waiting list of 7.57 million). Among them I estimate there are 27,238 patients whose eventual diagnosis will be cancer, but that cancer is currently unsuspected so they are not protected by the cancer waiting time targets. As we will see below, they will typically wait 42.6 weeks for diagnosis and decision.
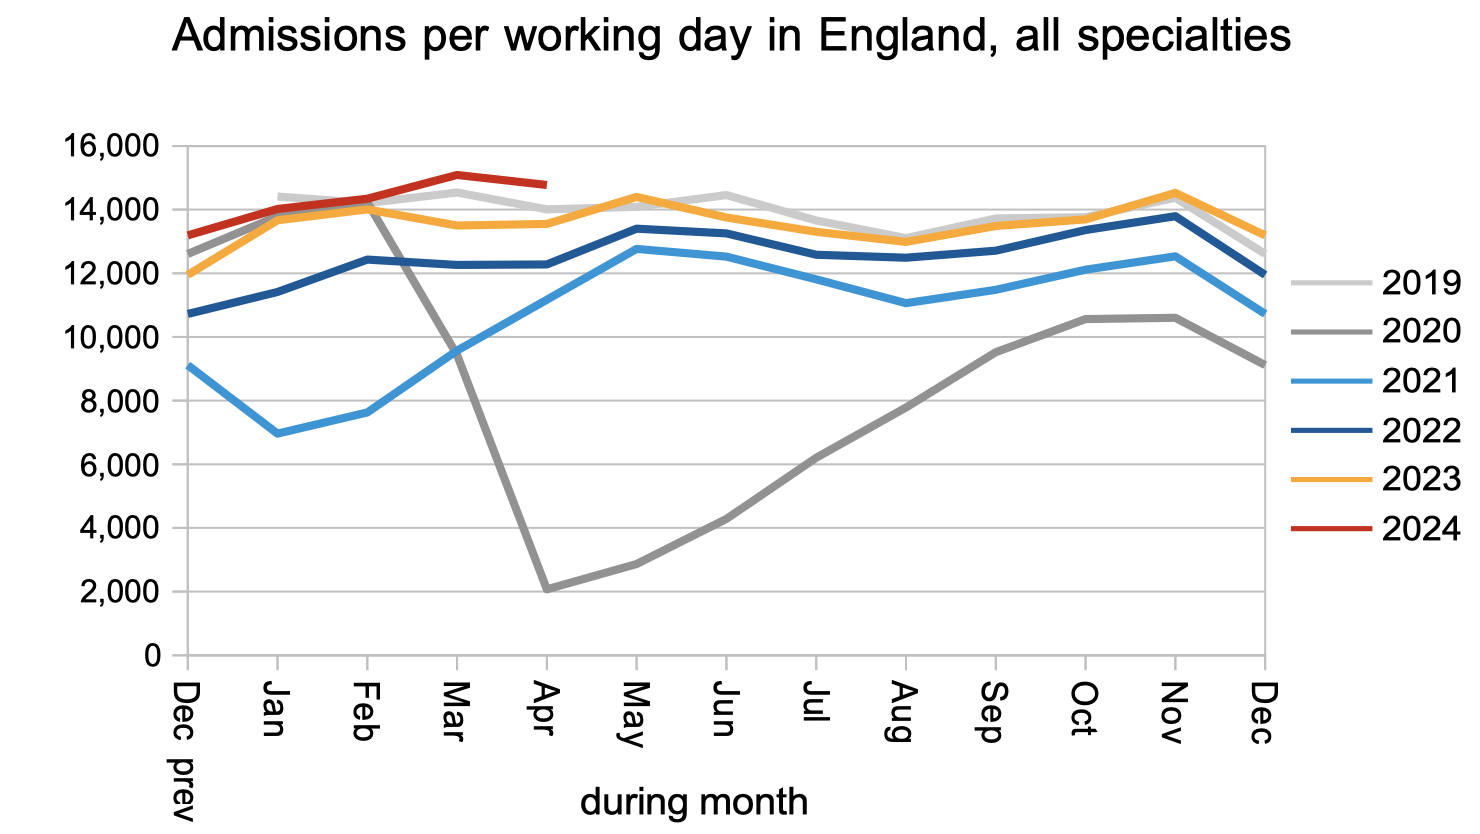
Patients were also admitted for inpatient and daycase treatment at higher than pre-pandemic rates.
The net result of all those clock starts, admitted and non-admitted clock stops, and the 10-15 per cent of clock starts that disappear from the data every month because data quality is poor, was that the waiting list grew slightly. The apparent drop of 40,000 in (mostly) February was caused by community services being excluded from the data from that month onwards.
Both the Conservative and Labour parties have committed to restore the statutory 18 week standard within five years, so the red triangle in the chart below is about to take centre stage. That is where the English RTT waiting list needs to shrink to before ’18 weeks’ becomes achieveable again, if the waiting list shape returned to 2013-16 levels. If the shape doesn’t improve then the list size would have to fall all the way to the red diamond.
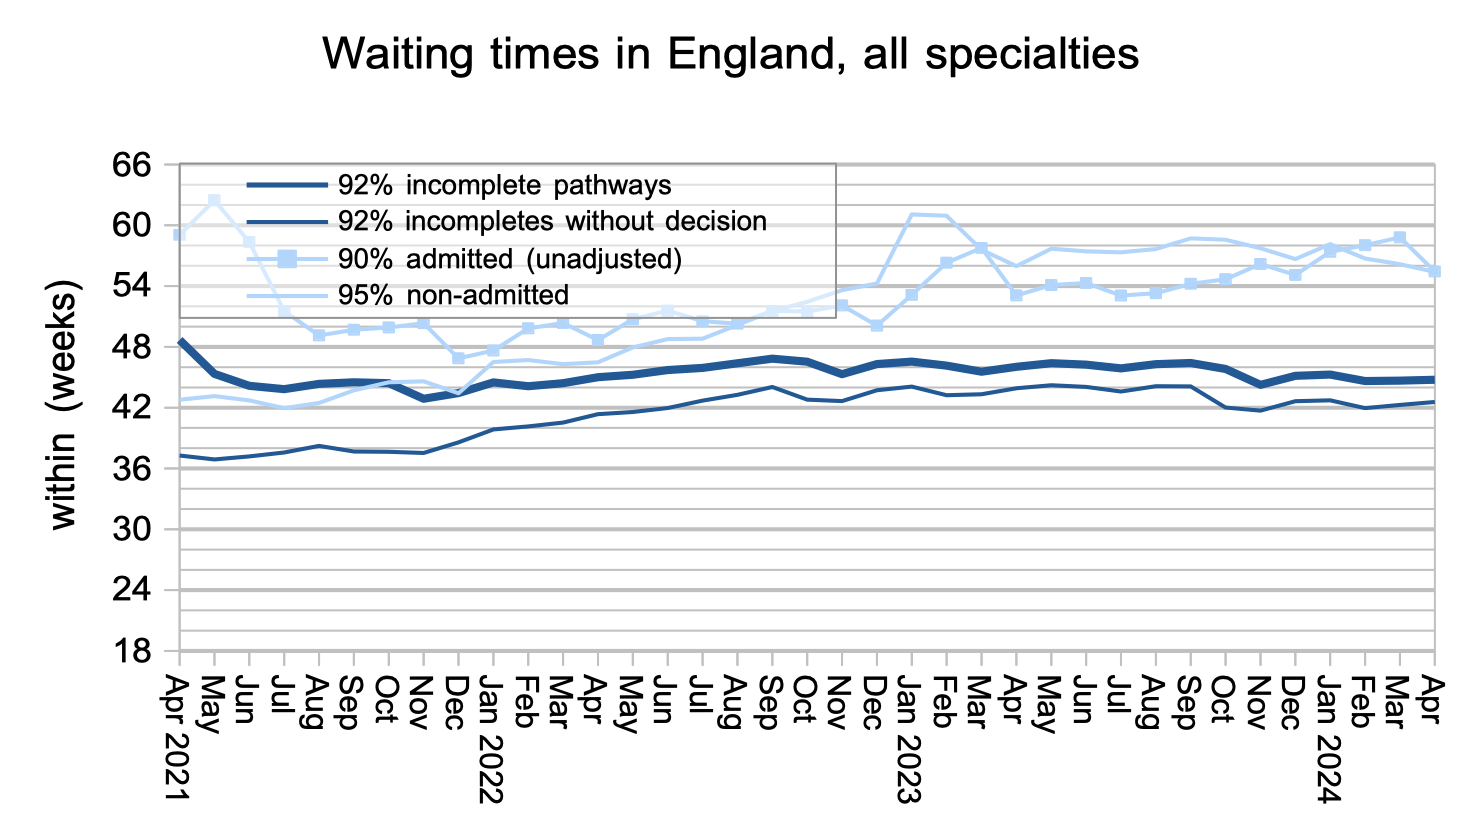
Referral-to-treatment waiting times (heavy dark line below) rose slightly to 44.8 weeks in April, and the wait to diagnosis and decision to admit rose to 42.6 weeks. (Don’t try to subtract one from the other – it doesn’t mean what you might think it means.)
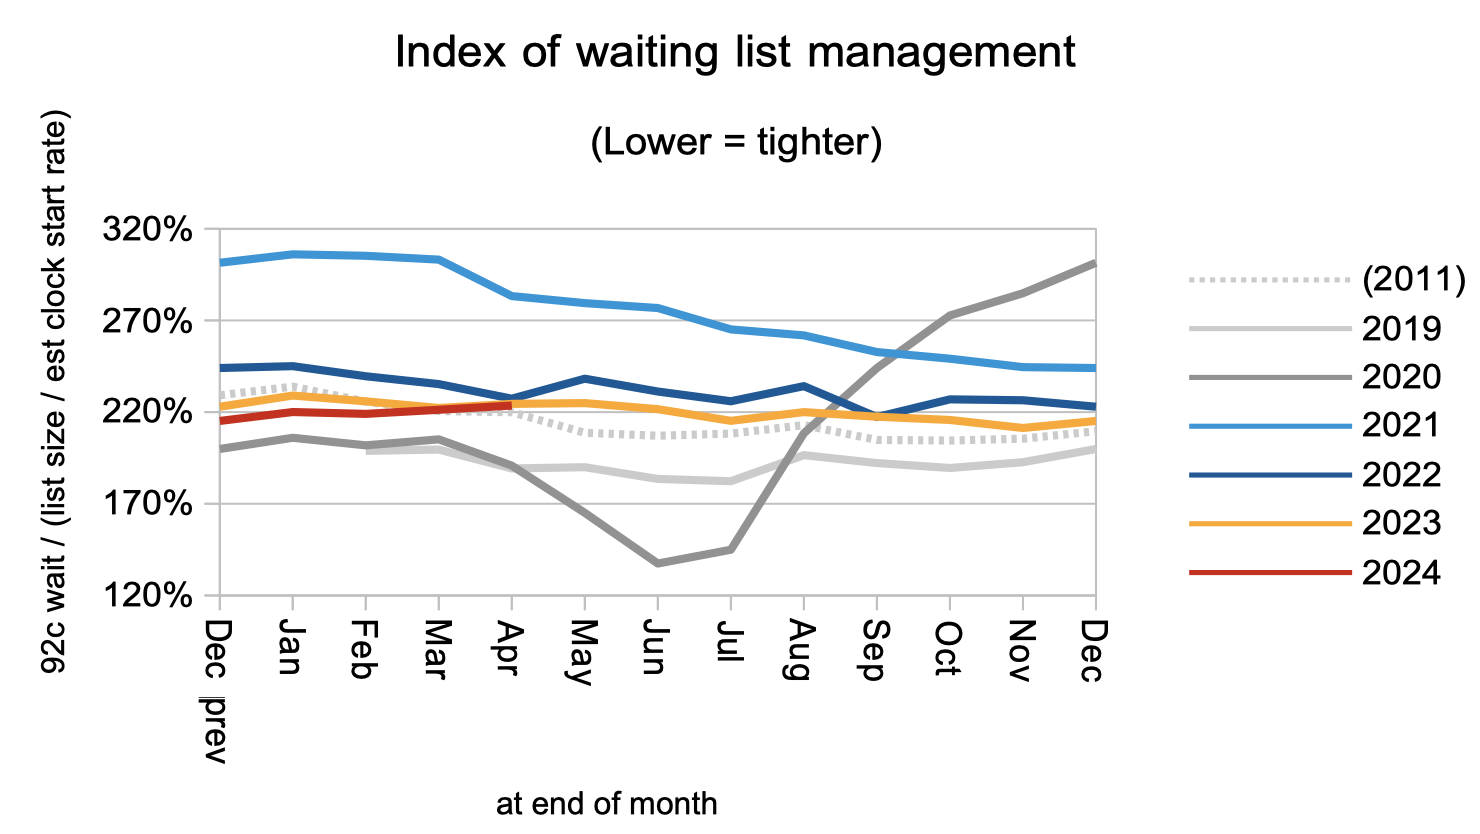
The waiting list shape is encapsulated in the index plotted below. The current shape of the national waiting list is mostly driven by variation in waiting time pressures across the country, and it remains relatively poor. From 2013-16, when it was at its best, it averaged just 179%.
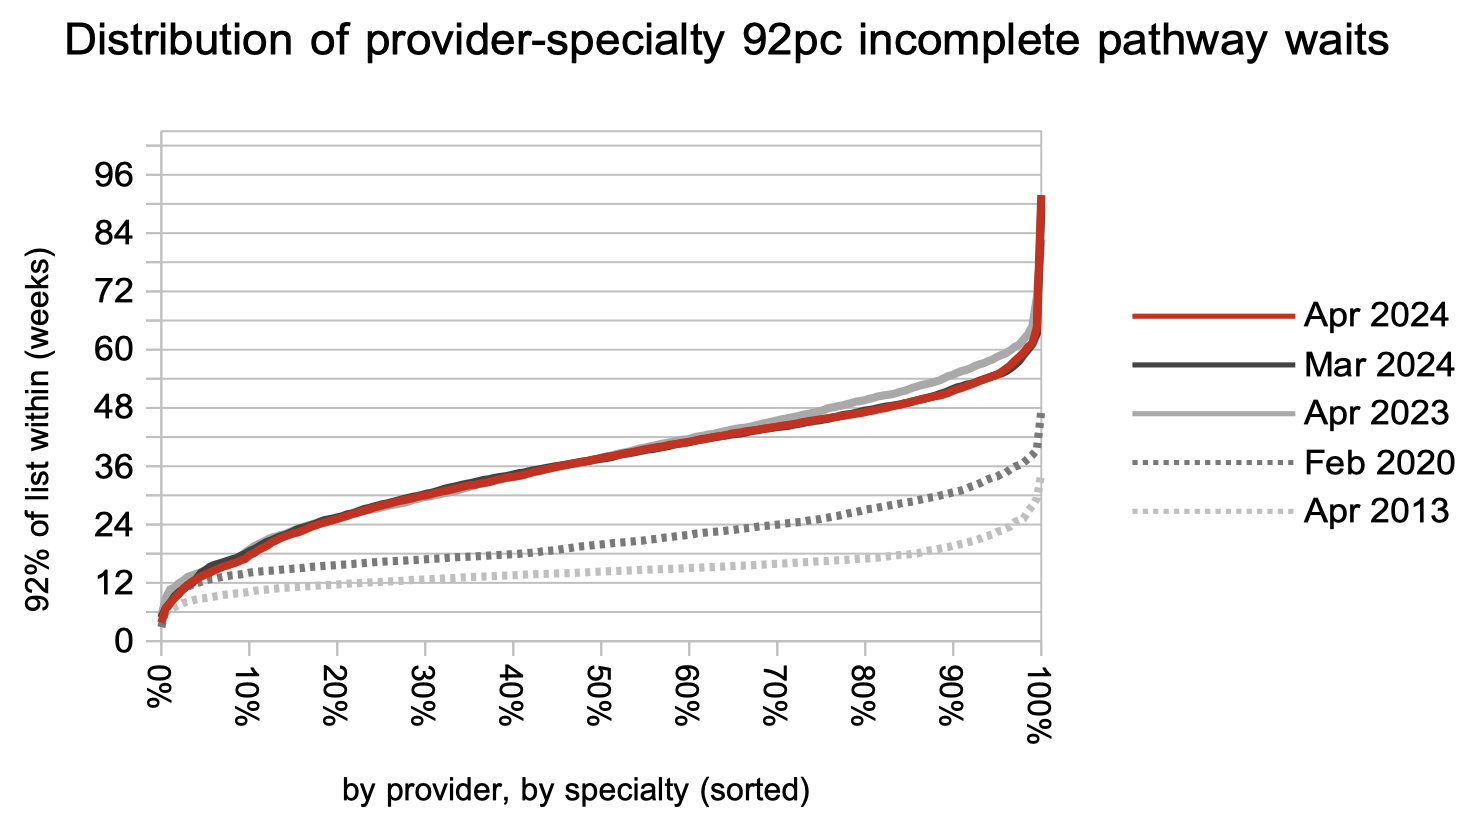
ENT is now the longest-waiting specialty in England at a typical routine wait of 50.2 weeks. Note that the wildly fluctuating mental health waiting times are unreliable because many mental health trusts do not report data.
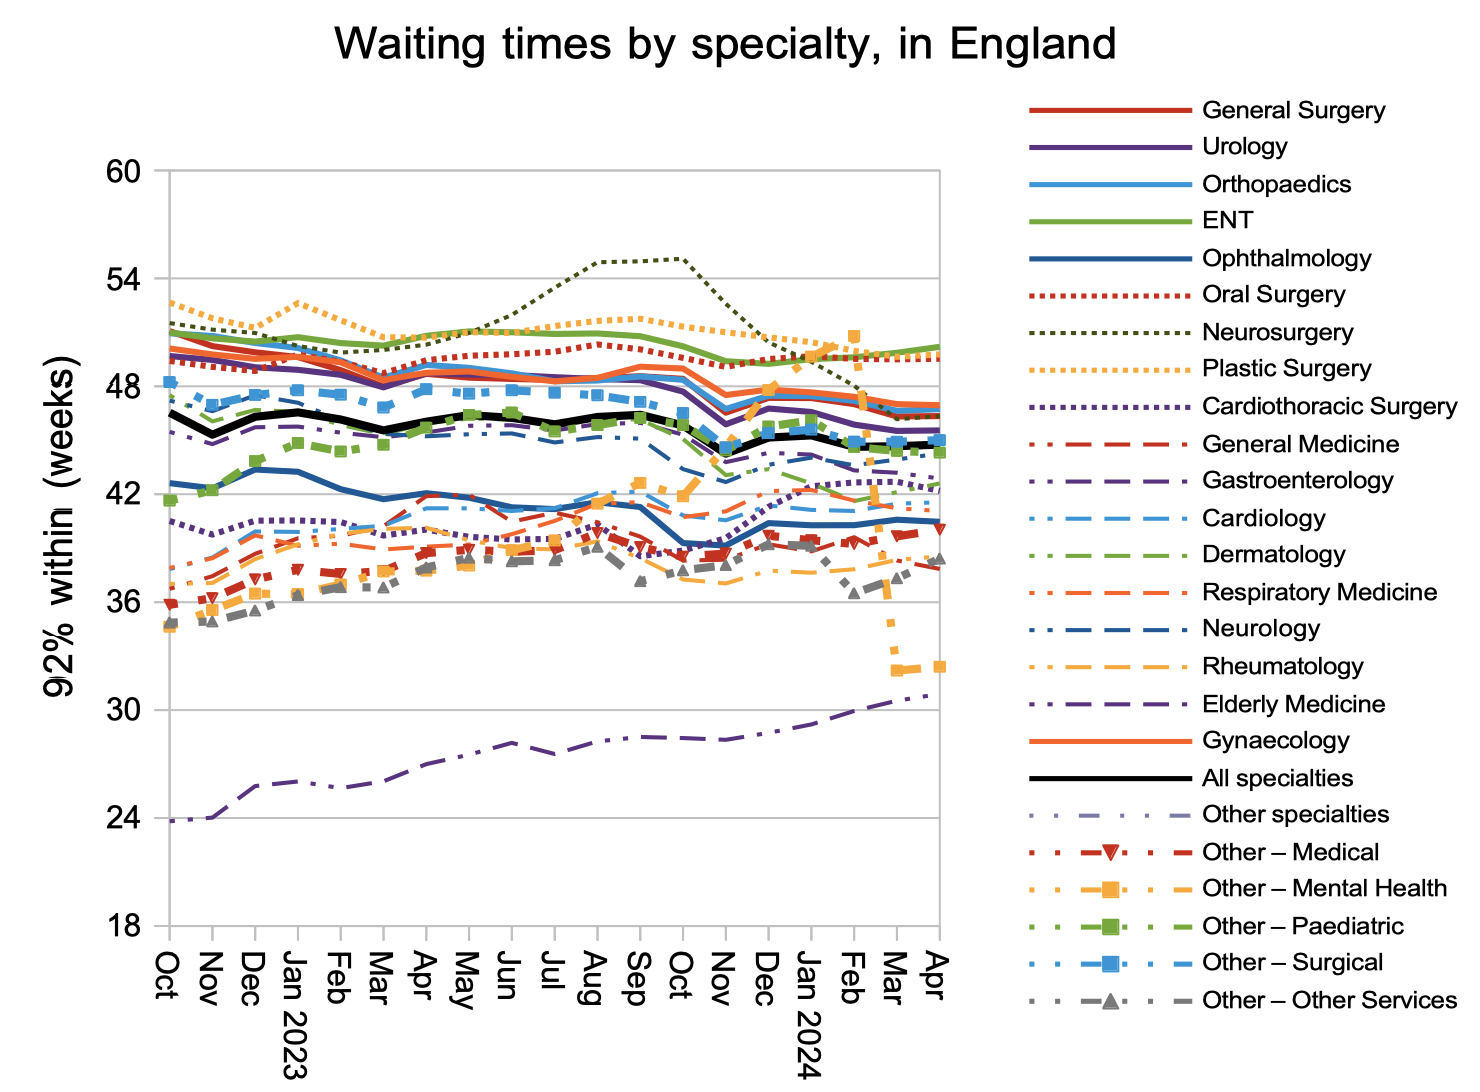
Looking at the detail, by specialty and by trust, the waiting time experience has not changed over the past year for most patients. There has been some improvement towards the long-waiting end of the scale where the current targets are. After the election, we can expect the focus to shift towards re-achieving the statutory 18 week standard, which will mean shifting the whole distribution to somewhere approaching the 2013 line below.
Referral-to-treatment data up to the end of May is due out at 9:30am on Thursday 11th July.