

(This article first appeared in the Health Service Journal)
Our duty of candour requires us to explain the consequences of [the current funding settlement] to help inform the difficult choices which will be made in the years ahead. On the current funding outlook, the NHS waiting list will rise to 5 million people by 2021… the government would have to publicly, legally abolish patients’ national waiting times guarantees.
Simon Stevens, at NHS Providers annual conference (8 Nov)
The logic is correct. If there isn’t enough money to do everything, then we must do less of something. But clinical priorities come first, so any slowdown must be focused in routine elective care. If we treat fewer routine patients then waiting lists and waiting times will rise.
In short, the government has a choice: constrain the money and abandon the right to treatment within 18 weeks, or cough up and honour it. I think most people reading this would plump firmly for the latter. But the question is: how much would it cost?
Before doing the sums, let’s look again at that logic about clinical priorities. The queue for extra money is a long one and routine waiting times are right at the back, behind A&E, cancer, and all the staffing costs and infrastructure maintenance that keep the NHS going. Moreover, if capacity is congested then elective surgery gets driven out when the beds are full of emergencies or cannot be staffed. So the Chancellor cannot simply plonk a couple of billion on the table and declare that it will solve elective waiting times, when so many other priorities have first call.
A better question then is: after everything else has got what it needs, how much extra would it cost to restore 18 week waits?
The answer comes in two parts: the recurring spend that would stop waiting times from growing, and the non-recurring spend that would clear the backlog that has already built up. Let’s take the recurring element first because it is the most important.
The recurring commitment
There would be little point in clearing the backlog at high marginal cost, only to let everything slide back again afterwards because activity falls chronically short of demand. We’ve been trying that experiment for several years now and the failure is evident. So restoring 18 weeks must be founded on a long-term recurring commitment to stop waiting time pressures from growing thereafter.
The sums are trickier than you might expect, because demand rises over time, so patients are added to the waiting list faster, and we can sustain 18 weeks with larger and larger waiting lists (for an explanation of this effect, see Little’s Law). The chart below shows the year-on-year growths over recent years in a) the waiting list, in grey; b) the estimated rate that patients are added to the waiting list, in green; and c) the ratio between the two, in red; with horizontal lines showing the average of each (the green and red ones happen to be almost on top of each other).
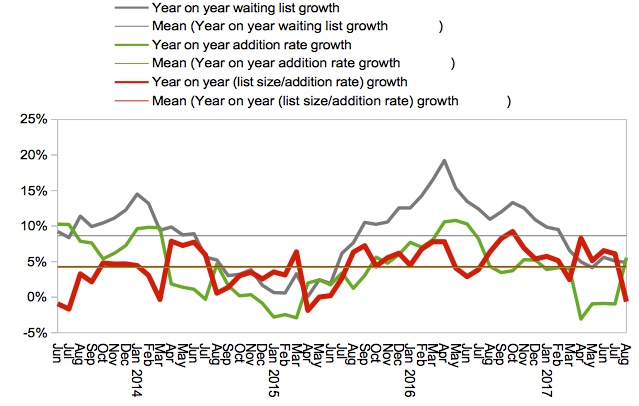
The waiting list and addition rate fluctuate quite a lot over the years, but when you consider the ratio between the two (which is what matters here) it is more stable. Remember that the question we want to answer is: “what is the recurring increase in activity needed to stop waiting times from growing?” So we need to know how much activity needs to increase, so that the growth in the waiting list is no faster than the growth in the addition rate.
The average growth in the waiting list in the chart above is 8.6 per cent year-on-year, and this is driven by trends in demand and activity. If you take the August 2017 waiting list of 3.9 million patients (ignoring non-reporting trusts), and inflate it by 8.6 per cent, you get a list of 4.2 million in August 2018. (As a cross-check, inflating it to the end of 2020 gives a waiting list of 5.1 million, which ties in nicely with Simon Stevens’s figure.)
The average growth in the addition rate is 4.2 per cent year-on-year. Inflating the list size by that amount allows us to estimate the waiting list a year later if waiting time pressures remained the same as now: 4.0 million.
The difference between the two is 170,000, which is the minimum amount of annual waiting list growth that we need to avoid by doing extra activity if we are going to stop waiting time pressures from growing year-on-year (assuming that ‘demand management’ has already reached its limits).
However a wise Chancellor would buy more. Why? Because we are in Wilkins Micawber territory here: we can either have waiting time pressures that get slightly worse every year (result: misery), or slightly better every year (result: happiness).
We should also remember that ‘extra’ activity in this analysis means ‘above the trend growth of recent years’. But 2018-19 is supposed to be the bottom of the financial “U-bend“, so the assumption that higher priorities and trend growth will be funded is important. If there isn’t the staffed capacity to accommodate rising emergency demand, as well as continue the trend growth in elective activity of recent years, then any below-trend shortfall in elective activity would need to be added to this ‘extra’. The numbers are potentially quite large: illustratively if elective activity fell 1 per cent below trend, that would add another 160,000 to the ‘extra’ activity.
The non-recurring backlog clearance
The next task is to work out the non-recurring backlog clearance that is likely to be needed, and again there are subtleties to be taken care of.
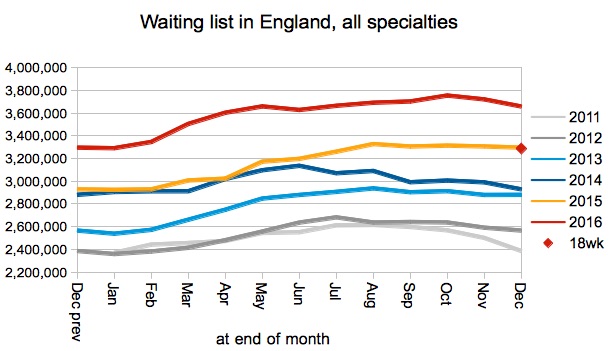
Let’s take the end of December 2016 waiting list as our starting point (you’ll see why in a moment). There were 3.7 million patients on the waiting list. If we assume that the recurring activity we calculated above is going to kick in from 1st April 2018, then we can assume that waiting time pressures stop growing from that moment onwards. Until then, however, the trend growth continues. So let’s inflate the December 2016 waiting list by the trend list growth of 8.6 percent per year, for the next 15 months, which gives us an expected waiting list of 4.1 million at the end of March 2018.
Based on the waiting list management of the time (which was relatively good, and fairly typical of the years since 2013), I have estimated that the December 2016 list would have needed to fall to 3.3 million to be consistent with the target that 92 per cent of the waiting list should be within 18 weeks (shown by the red diamond in the chart below; a short explanation the method is next to a similar chart here). Inflating that sustainable 18-week list by the 4.2 per cent trend growth in additions gives us a March 2018 sustainable list of 3.5 million.
So the estimated backlog that would need clearing at the start of 2018-19 is the difference between the projected actual list size and the projected sustainable list size, which is about 600,000. This backlog clearance only needs to be done once.
But why did I pick December? For the backlog clearance to be successful, it needs to make the 18 week standard sustainable all year round (not just in a particular month). So I looked at the 12 months from August 2016 to July 2017 (ignoring August 2017 when waiting list management took a sharp turn for the worse). December 2016 was the month that required the biggest backlog clearance, so that is the clearance we need, to make 18 weeks consistently achievable all year round.
There is a further caveat. As I mentioned above, waiting list management abruptly slipped in August, which may be a combination of the lower priority being given to elective waiting times at the moment (although that has been the case since April), problems scheduling elective patients when capacity is congested, and difficulty in maintaining consistency of waiting times across different specialties when funding is preferentially constrained for the expensive ones. If these pressures across the system were to continue, then a higher index of waiting list management may prevail and a larger backlog clearance may be needed.
If we use the year 2011’s waiting list management as a proxy for the effects of capacity congestion, then we can estimate the larger backlog clearance that would be needed if other pressures in the NHS were not funded. Under that scenario, the required backlog clearance is just over 1 million patients.
May we have the bill, please?
And so we have our estimates of the extra patients who need to be treated. But at what cost? And here I must confess that I don’t have the faintest idea what combination of new and follow-up outpatient, diagnostic, and operation costs would typically apply to each of these clock stop scenarios and casemix scenarios. But let’s have a go anyway for the sake of illustration.
Backlog clearances are usually expensive because they rely on high marginal cost extra capacity, in the evenings and at weekends, at extra-contractual rates and with agency staff. Also, longer-waiting patients tend to be weighted towards the more expensive cases with the longest operating times and lengths of stay – they are the hardest and most expensive to find capacity for and that is precisely why they are kept waiting.
Recurring extra activity would be tilted towards a heavier casemix for the same reasons. Recurring costs will also depend on our assumption that other priorities and enough mainstream capacity are fully funded. If they are, then we could assume that all the extra activity would be done in mainstream capacity, during the main working week, with permanent staff, in which case the cost would be around the usual tariff for the casemix. But if other priorities are not funded, and mainstream capacity is not available, then we are probably facing the high marginal costs of waiting list initiative type work.
For the sake of illustration, then, let’s cost the recurring activity at £2,000 per case, reflecting the heavier casemix that we are keeping off the list, if we can do it in mainstream capacity during the normal working week. And let’s say £3,000 per case for backlog clearance work, which is also a heavy casemix but treated in extra sessions with agency staff in the evenings and weekends.
Now we can price up our two scenarios: that other pressures and enough mainstream capacity are either fully funded, or not funded.
Under the “fully funded” scenario, in 2018-19 we need to do recurring activity of 170,000 patients at £2,000 per case which comes to £350 million. The backlog clearance is 600,000 patients at £3,000 per case which comes to £1.8 billion (which only needs to be done once). So the total cost is £2.1 billion in 2018-19 and £350 million in subsequent years.
If other pressures and enough mainstream capacity are not funded, then the recurring activity is still 170,000 over trend, but we also need further activity to get back up to trend: 160,000 extra patients if the shortfall is 1 per cent of clock stops. Doing all that at the high marginal cost of £3,000 a case comes to £1 billion each year. Then the backlog clearance with poorer waiting list management is just over 1 million patients at £3,000 each, which costs £3.2 billion in 2018-19. So if other pressures and enough mainstream capacity are not funded, the total cost is £4.2 billion in 2018-19 and £1 billion in subsequent years.
The latter scenario is a bit like scrimping on the weekly shop and topping up with takeaways. But I might cheekily suggest that this is already established practice in the NHS, so perhaps the local takeaway shops can look forward to plenty more lucrative business in the coming years if the scrimping continues.
If you want to pore over the numbers in more detail, here is a spreadsheet that lays it all out:
Excel format (without the charts)
If you are wondering why I didn’t use Gooroo Planner for this, the answer is that the national waiting list shape is dominated by the variation in waiting time pressures across thousands of local services, instead of being dominated by patient scheduling which is the case when considering each local service separately. Gooroo Planner is designed for modelling local services separately, and therefore approaches waiting times from a patient scheduling perspective. Which means that for this national-level analysis I had to take a different approach to waiting times based on the index of waiting list management.