

If you spend £250 million on something, you might expect to see some sort of benefit. But at the halfway mark of England’s summer waiting list initiative, the money is so far disappearing without trace.
The idea was that Trusts would lay on extra capacity up to the end of the financial year, with a particular focus on July and August when they would treat their longest-waiting patients and then be in good shape to achieve all four referral-to-treatment targets from September until the General Election.
How could we tell if that strategy worked in July?
If you’re giving the NHS extra money to treat more patients then (at the risk of being obvious) you might expect the NHS to treat more patients. But it didn’t. In fact the number of patients admitted per working day was the lowest of any July in the last four years.
If you’re also allowing Trusts to treat all their longest waiters, even at the expense of breaching the perverse “adjusted admitted” target, then you might expect to see fewer long-waiters left behind on the waiting list. But that didn’t happen either. The number of over-18-week waiters on the waiting list rose by 3 per cent during July, even though the “adjusted admitted” target was breached at national level.
If the whole point is to tackle the longest waits in the NHS, you might expect those services with the longest waiting times to improve the most. But they didn’t. Long waits got longer, and short waits got shorter.
What went wrong? The short answer is that I don’t know, but here are some possibilities.
Perhaps the waiting list initiative is a drop in the ocean during a rising tide. The waiting list has been growing by around a quarter million patients per year for the last two years, so funding an extra 100,000 treatments may be too little to make a difference.
Perhaps July is too early to see any effect. After all, the money had only just been allocated and it takes time to arrange capacity. Maybe everything will turn out alright in the August figures. Or the September ones.
Perhaps the money was misallocated through poor, rushed capacity planning. Perhaps Trusts weren’t sure if their CCG was going to penalise them £400 for treating each long-waiter, so they treated short-waiters instead. Perhaps the whole exercise focused too much on expensive activity at the margins (extra capacity at weekends or the private sector, longest waiters on the PTL) instead of addressing the baseline.
Whatever the cause, it’s a disappointment. We can only hope that things turn out a lot better in the August data.
In the following analysis, all figures come from NHS England. If you have a national statistic that you’d like to check up on, you can download our Gooroo NHS waiting times fact checker
England-wide picture
It looks from the chart below as if the total size of the waiting list has been coming down nicely. But don’t be fooled: no fewer than 7 Trusts failed to submit any waiting list data, and another 2 submitted only partial data. NHS England’s Statistical Press Notice estimates the true waiting list at just over 3.2 million.
Here is the last reported position at each missing Trust (omitting the Queen Elizabeth in Woolwich which was part of South London Trust and did not report separately):
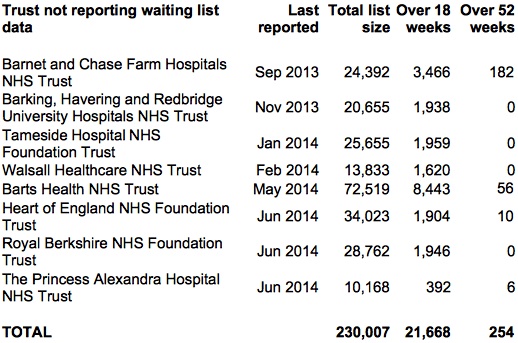
Non-reporting Trusts
For what it’s worth with all that missing data, here is the official size of the English waiting list.
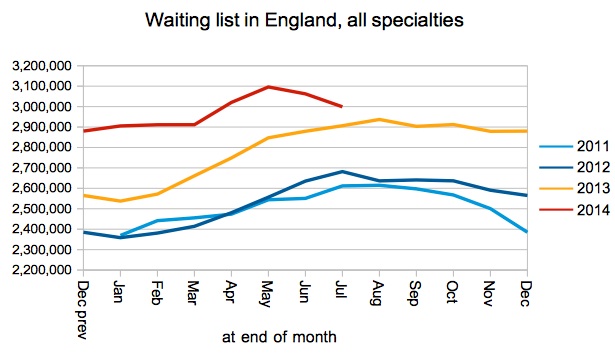
Total waiting list
In spite of the extra money and capacity that was supposed to be laid on, the NHS actually admitted fewer consultant-led inpatients and daycases per working day than in previous years. Again, these figures may be affected by data problems as 5 Trusts did not submit admissions data.
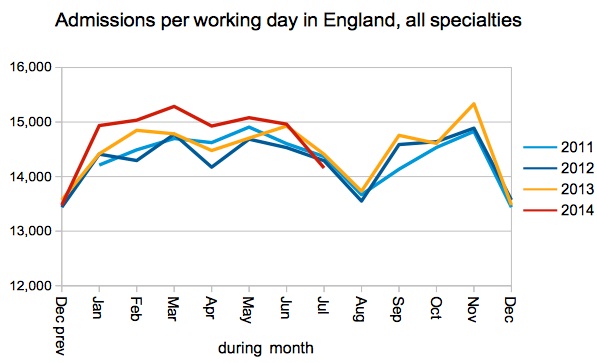
Admission rate
The reported number of over-18-week waiters rose from 189,571 to 195,318 during July. But it’s anybody’s guess whether we can rely on those numbers very much with over 20,000 over-18-week waiters probably missing from the reported data.
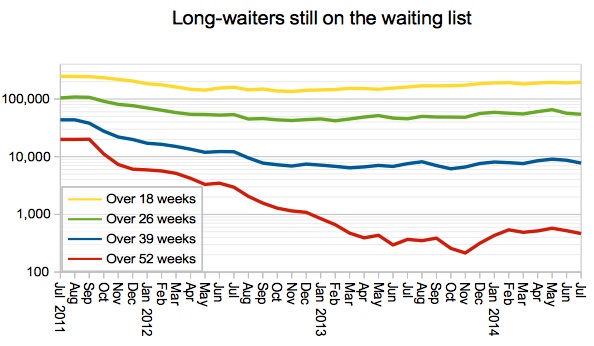
Long-waiters on the waiting list
My preferred barometer of waiting times performance showed things getting slightly worse, when they should have got a lot better.
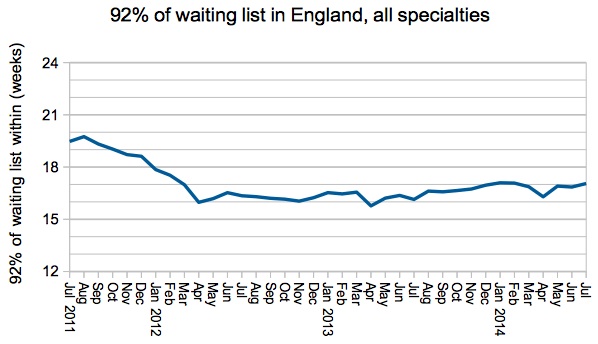
92pc of waiting list within
At specialty level there was deterioration in all the big surgical specialties, even Orthopaedics which is a particular focus of the national waiting list initiative.
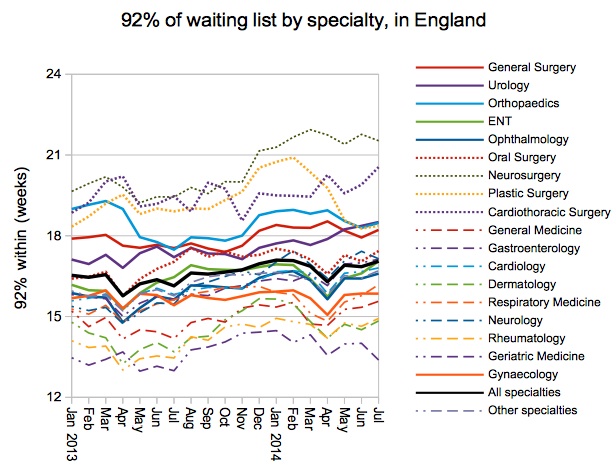
92pc of waiting list by specialty
You might expect a well-targeted waiting list initiative to at least tip some services from breach to success, but actually fewer services (by Trust, by specialty) were achieving the 92 per cent target at the end of July.
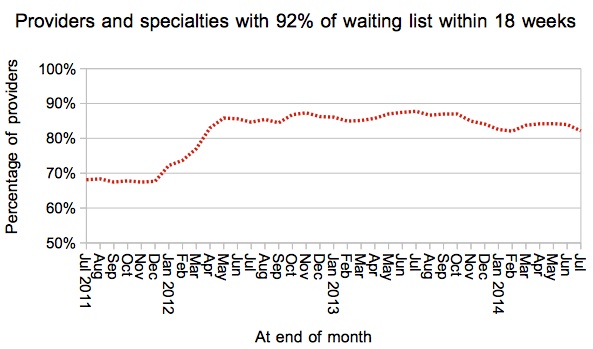
Trust-specialties achieving 92pc target
The distribution of 92nd centile waiting times (by Trust, by specialty) shows that the long waits got longer, and the short waits got shorter. Again, this is the opposite of what you might expect in a well-targeted waiting list initiative.
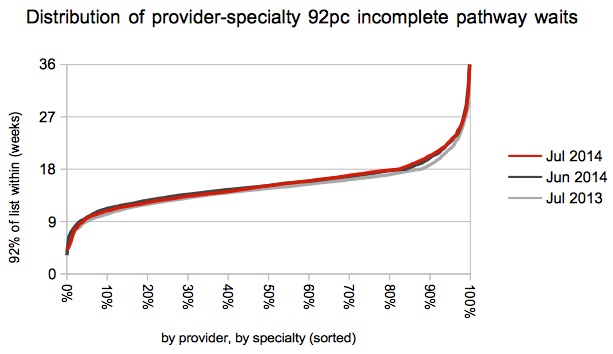
Distribution of Trust-specialty waits
Local detail
There are interactive maps showing the all-specialties position at every Trust and CCG. For specialty-level analysis at a particular Trust, independent sector provider or CCG, visit our 18-weeks reports page.
There is very little movement at the top of this month’s chart, but there are some new entries further down the list. This does of course exclude the 7 Trusts who did not report any waiting list data.
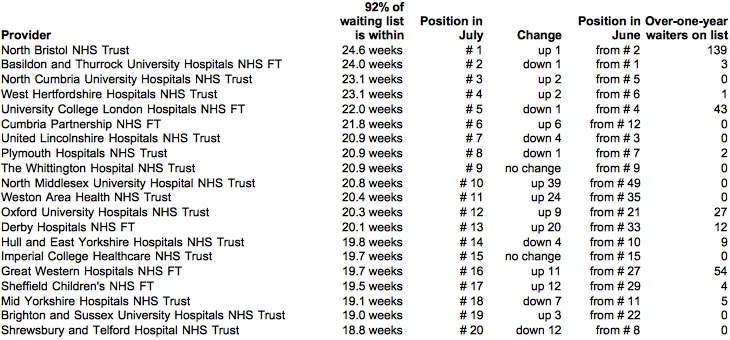
Top twenty
Congratulations to Mid Cheshire for dropping out of the table in spectacular style, as their 92nd centile waits fell from 18.4 weeks to 15.3 weeks during July.
In a curious quirk, caused by waiting times getting worse at so many Trusts, July saw instances of Trusts dropping out of the table even though their waiting times deteriorated; they just didn’t deteriorate as fast as other Trusts who overtook them.
Data for August 2014 (and a whole bunch of revisions) is due out at 9:30am on Thursday 9 October 2014.