

Elective RTT waiting times shot up by over a week in December, in the fastest monthly increase since 2010.
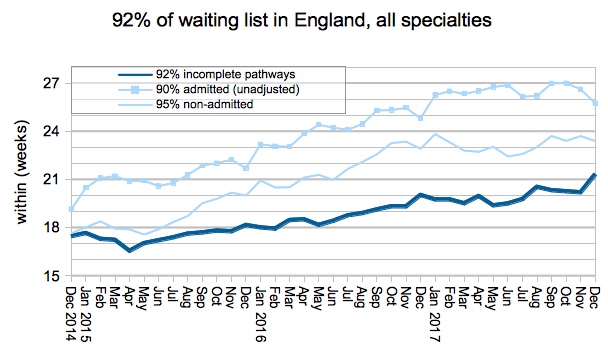
At the end of November 2017, 92 per cent of the waiting list (incomplete pathways in RTT jargon) had waited less than 20.2 weeks. By the end of December it was 21.3 weeks. The target is that 92 per cent of the waiting list should have waited no longer than 18 weeks.
What caused it? In December it was mostly a loosening of waiting list management, as waiting times increased rapidly in longer-waiting local services. This may be the result of competition for capacity with non-elective and urgent demand in particular providers.
For analysis of waiting times performance at a particular organisation, visit our reports page. You can also access maps of the latest waiting times across England for A&E, cancer, and RTT.
In the following discussion, all figures come from NHS England. If you have a national statistic that you’d like to check up on, you can download our RTT waiting times fact checker.
England-wide picture
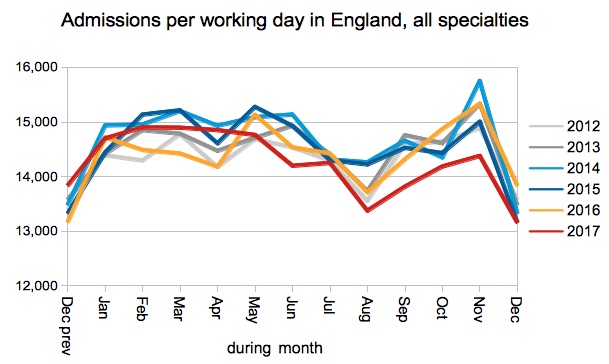
Waiting times for incomplete pathways shot up, as fewer long-waiting patients were admitted for inpatient or daycase treatment in the run-up to Christmas – suggesting competition between elective and non-elective patients for limited beds, theatres and staffing capacity.
United Lincolnshire Hospitals NHS Trust and Mid Essex Hospital Services NHS Trust started reporting RTT data again after short absences (of 2 months and 1 month respectively). Between them they have restored about 70,000 patients to the national waiting list.
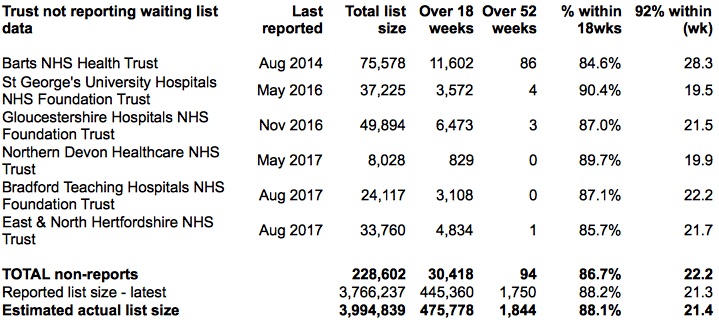
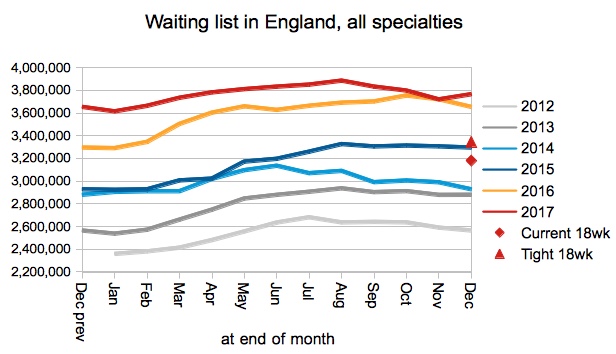
The officially reported waiting list – shown in the chart below – does not include non-reporting trusts and unfortunately the picture is heavily affected by them. So it is helpful of NHS England to report in their statistical press notice that the waiting list grew 4.2 per cent year-on-year (after adjusting for non-reporting trusts).
4.2 per cent also happens to be the trend growth in the rate that patients are being added to the waiting list, and that coincidence means the overall effect is neutral year-on-year in terms of the underlying waiting times pressures.
So why did waiting times rise?
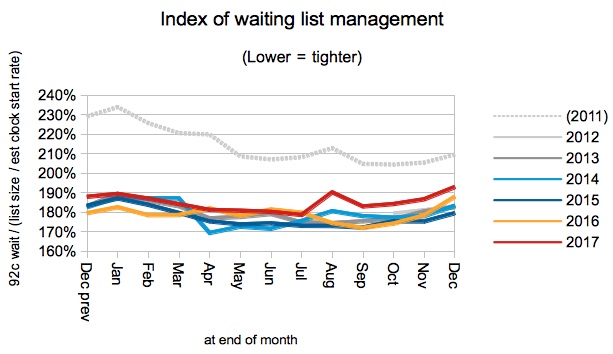
Waiting times are a function of both the list size and the order in which patients are treated. The waiting list tends to shrink seasonally at this time of year, but waiting list management tends to loosen (perhaps as the result of competition for capacity). Looser waiting list management tends to win this battle, resulting in an overall increase in waiting times. Which is what happened again this year.
Waiting list management has also remained looser than in recent years since it abruptly slipped in August, and that enhances the effect on overall waiting times.
Admissions per working day continue to run below the rate of recent years. NHS England/Improvement’s plans for 2018-19 reckon they can reverse this by enough to stop waiting times from getting worse.
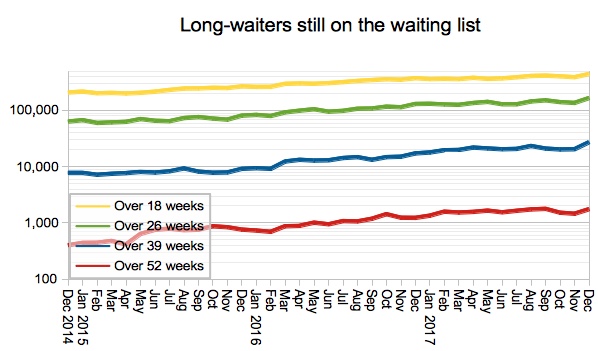
One-year waits continue to run at a high level, and again NHS England/Improvement are planning to reverse this growth in 2018-19 by halving the number of one-year waits. This is desirable and – given the small numbers involved – should be possible if there is co-ordination between providers.
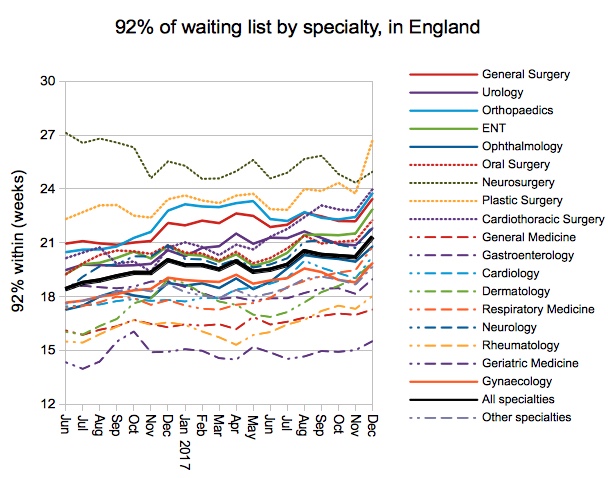
Most specialty-level waiting times rose by about a week, with the exception of General Medicine (which rose only 0.3 weeks) and Plastic Surgery (a whopping 3 weeks).
The sharp rise in Plastic Surgery will have been boosted by Mid Essex Hospital Services NHS Trust restarting reporting, because they have large plastic surgery centre, with around 12 per cent of the national waiting list in this specialty, and a 92nd centile waiting time of 35.6 weeks.
Local detail
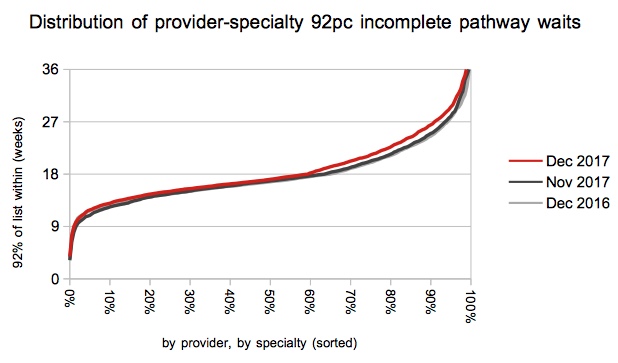
The proportion of local provider-specialties achieving the 18 week target dipped sharply from 63.5 per cent to just 59.4 per cent.
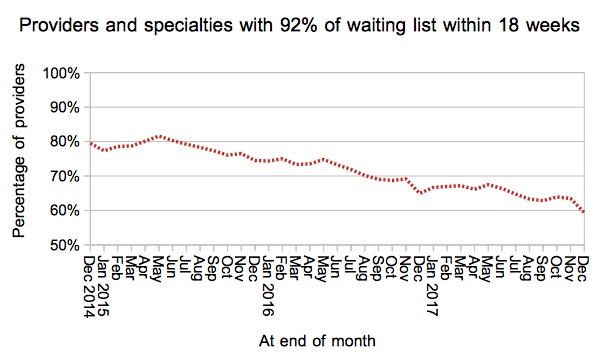
The distribution of waiting times across those 2,500-odd local services, shown below, provides a bit more detail. The chart above is tracking the point where the red line crosses 18 weeks in the chart below, and it’s unzipping as waits rise sharply at the long-waiting end of the spectrum.
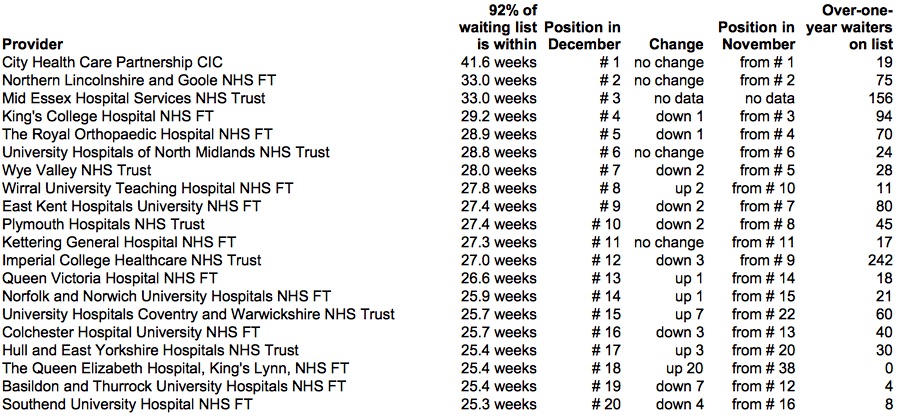
There was little change in the table of top twenty long-waiting providers, except for the sudden appearance of The Queen Elizabeth Hospital, King’s Lynn, NHS Foundation Trust. Looking at their integrated performance report it seems they are still carefully tracking their performance against RTT targets that were abolished back in 2015…
Data for January 2018, which will show the effect of that month’s national slowdown in elective activity, are due out at 9:30am on Thursday 8th March.