

The elective admission rate fell 3.5 per cent year-on-year and was easily the lowest September figure in the last 6 years, according to the latest referral-to-treatment data from NHS England.
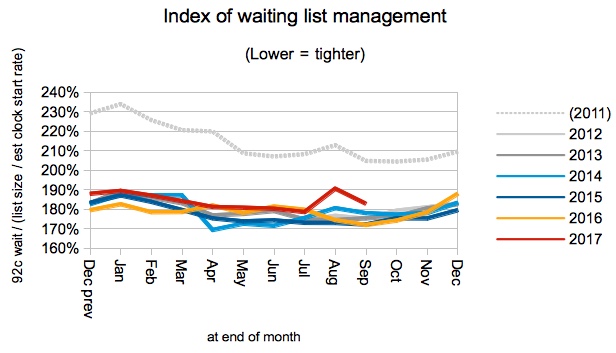
In spite of this the number of patients on the waiting list remained broadly steady, which is usual for the time of year. And waiting list management largely recovered after August’s surprising wobble, allowing a small overall improvement in waiting times across England.
The outlook for referral-to-treatment (RTT) waiting times remains poor. The long term trend is for rising waiting times, fuelled mainly by a growing waiting list, and the possibility that capacity congestion and restricted funding for high-cost specialties will worsen waiting list management. If the 18 week waits promised in the NHS Constitution are ever to be recovered, then the faltering admission rate and the capacity that underpins it will need to be strengthened.
For analysis of waiting times performance at a particular organisation, visit our reports page. You can also access maps of the latest waiting times across England for A&E, cancer, and RTT.
In the following analysis, all figures come from NHS England. If you have a national statistic that you’d like to check up on, you can download our RTT waiting times fact checker.
England-wide picture
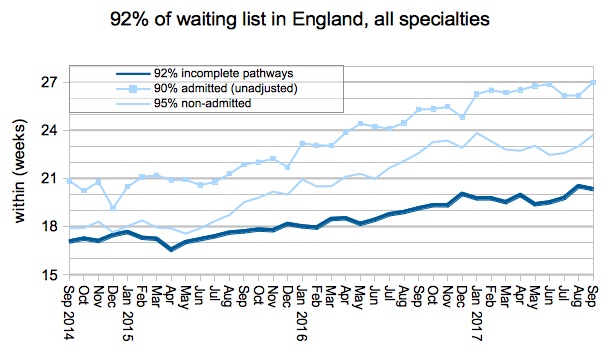
There was an increased focus on treating long-waiting patients in September, which improved overall waiting list management and delivered a small improvement in waiting times. However waiting times remain well above 18 weeks and the long term trend is up.
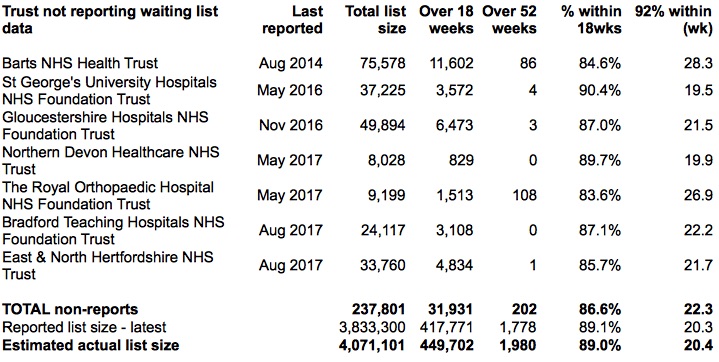
Two more trusts went on “reporting holidays” because of problems with their new IT systems, pushing non-reporting close to historic highs and reversing the encouraging returns to reporting earlier in the year.
The number of patients waiting was broadly steady in September, whether you include non-reporting trusts or not.
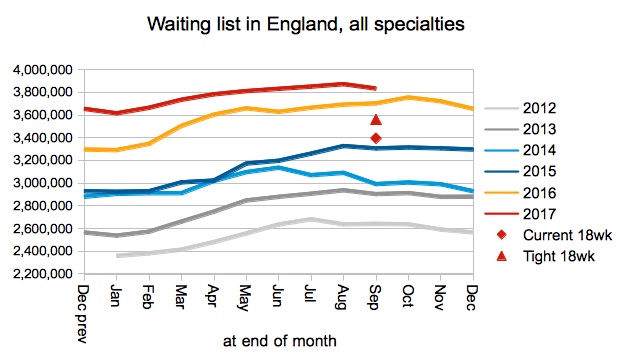
In the chart above I have added a new red blob, and I’ll explain here what it means. The red diamond represents the size of waiting list that would be consistent with achieving 18 weeks nationally, assuming current waiting list management (shown in the chart below). That was working well while waiting list management remained steady.
However in August we saw a surprise loosening of waiting list management. So I have added a new red triangle above, to show the list size consistent with 18 week waits if waiting list management were at the average 2013-2016 levels for the calendar month.
The rationale is that waiting list management can loosen or tighten relatively quickly (compared with how fast the waiting list grows and shrinks). It is driven locally by patient scheduling (which can change very quickly indeed), and more widely by imbalances in waiting times between one local service and another (which changes more slowly). So it is useful to have a comparison that is based on the relatively tight management which has already been sustained for several years.
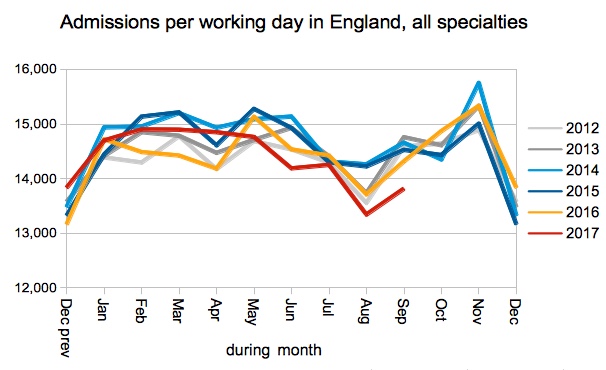
The number of admissions per working day is sharply down on recent years, repeating a tendency that started in June. This may be a sign of bed capacity filling up with emergency demand and displacing inpatient electives, although there is no way to tell the cause from the RTT data.
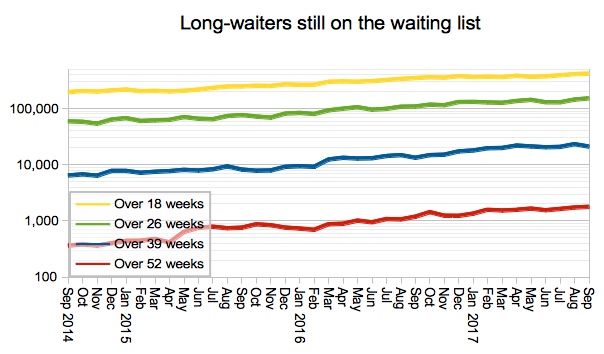
Long waits continued to rise, and there are now 1,778 over one year waiters reported on the English waiting list, with a quarter of them at Imperial College Healthcare NHS Trust where further long waiters have been found.
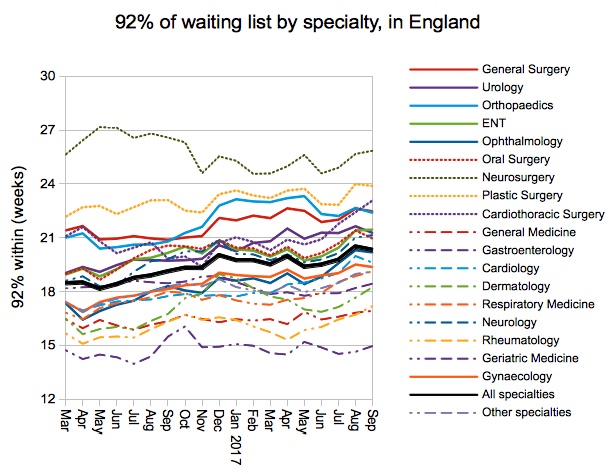
The only specialties that are now achieving 18 weeks nationally are General Medicine (at 16.9 weeks), Rheumatology (17.2 weeks), and Geriatric Medicine (15.0 weeks).
Local detail
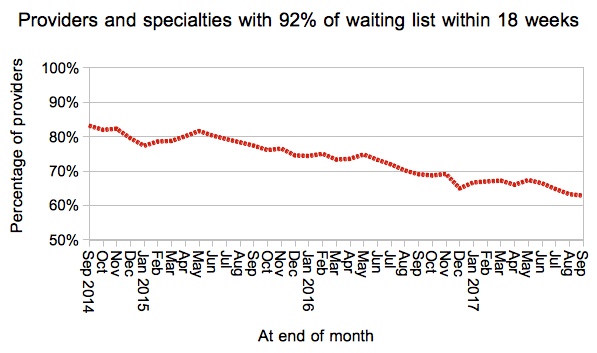
Of the 2,510 local specialties with waiting lists over 100 patients, just 62.8 per cent are now achieving 18 weeks at the 92 per cent of incomplete pathways level, in a continuation of the long term decline.
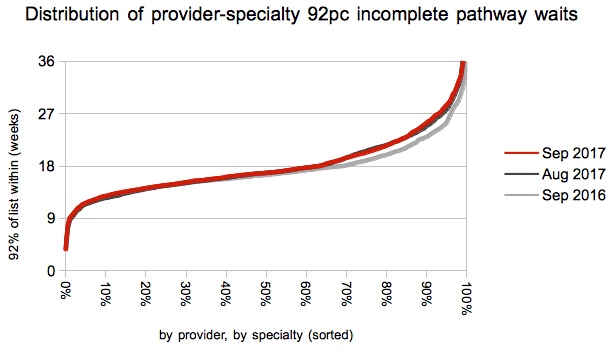
The increase in waiting times since last year remain focused at the longer-waiting end of the spectrum, with little change during September.
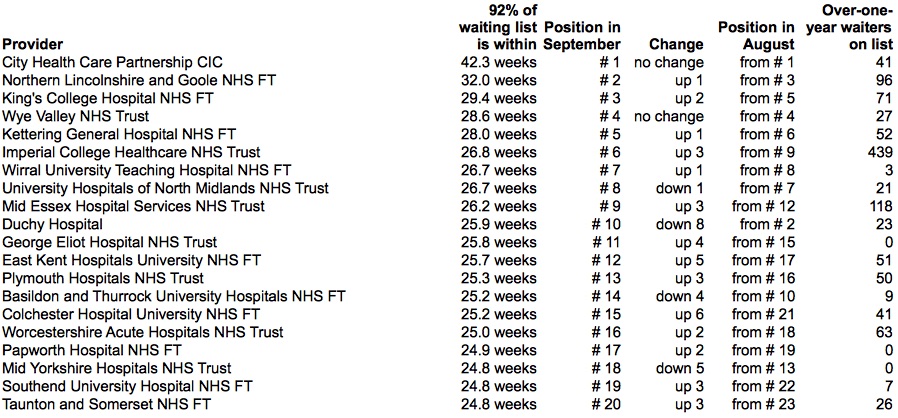
Looking at the top twenty longest waiting providers, there has again been little movement compared with the end of August.
Data for October 2017 is due out at 9:30am on Thursday 14th December.