

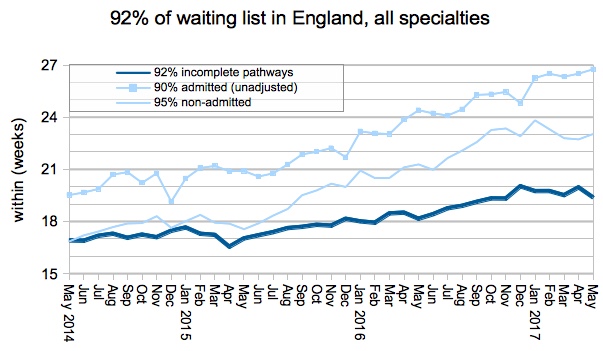
Performance against the 18 week referral-to-treatment (RTT) target improved to 19.4 weeks during May, swiftly proving the forecast I made last month – that over 20 week waits were here to stay – utterly wrong.
Nevertheless, I’ll stick my neck out again and predict that it won’t last. Compared with the previous year, May’s waiting list was over 4 per cent bigger, the number of over 18 week waiters was up by nearly a quarter, and waiting times were 1.2 weeks longer. There is no reason to think that these long-term increases are about to end.
Bad as those trends are, the deterioration was even worse for the longest waiting patients. Over-52-week waiters were up by nearly two-thirds on the year before, as were over-39-week waiters. Seasonal fluctuations in waiting times may come and go, but these year on year trends look set to stay.
In the following analysis, all figures come from NHS England. If you have a national statistic that you’d like to check up on, you can download our RTT waiting times fact checker.
England-wide picture
Waiting times often improve seasonally in the spring, and for the last two years those benefits have landed in May. The improvement over the month brought national waiting times back to their pre-Christmas levels. The year on year trend, however, is up.
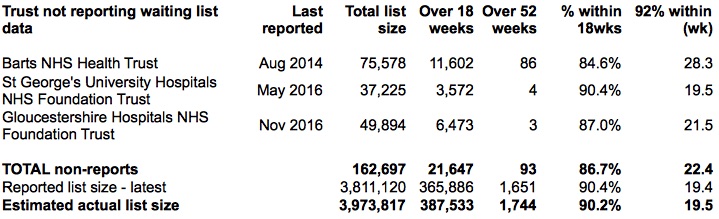
The list of non-reporting trusts was unchanged during the month. If you add their last reported positions back into the data, the English waiting list was very close to 4 million and may breach that level in next month’s data.
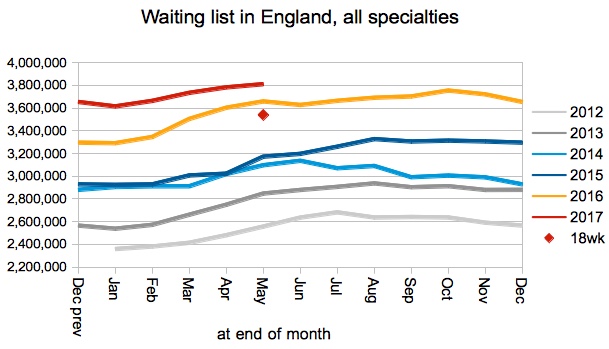
Returning to the unadjusted data, the waiting list remains larger than last year although the gap has been narrowing. The waiting list would probably have to shrink to below last year’s size before the 18 week target became achievable again.
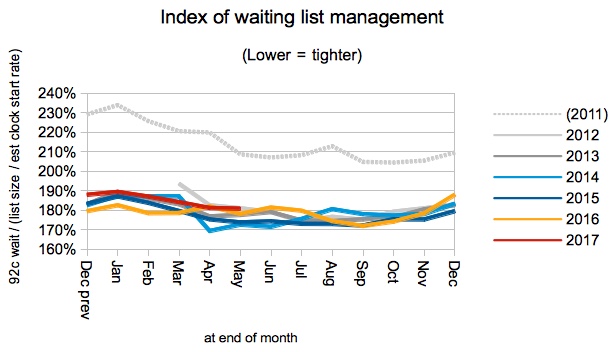
Waiting times are a function of the size of the waiting list (the chart above) and the order in which patients are treated (the chart below). Waiting list management has remained stable since the incomplete pathways target was introduced in 2012, which is a good thing. It also indicates that short RTT waits remain a priority for NHS managers, even though financial penalties for breaching the target have been lifted.
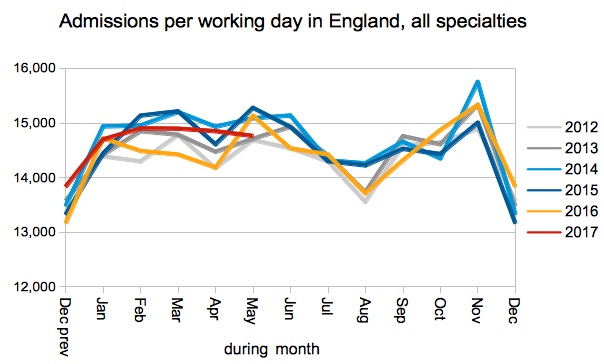
Elective inpatient and daycase admissions from the waiting list were lower, per working day, than in the last few years.
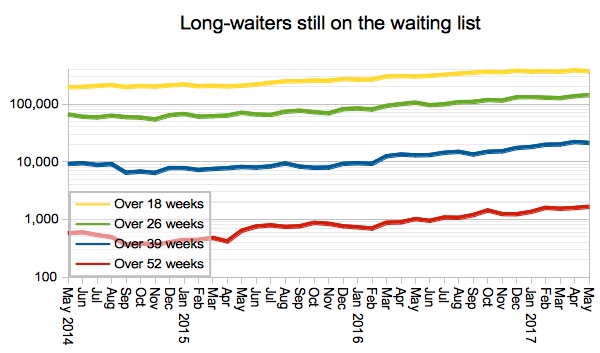
The next chart shows how many long waiters remain on the waiting list. It uses a log scale so that all lines can fit on the same chart, but the disadvantage of that is that large increases look less dramatic.
Unpicking the numbers, the number of over 52 week waiters rose 64 per cent year on year, as did over 39 week waiters. Over 26 week waiters rose 35 per cent, and over 18 week waiters rose 22 per cent. Is that a lot? Yes it is.
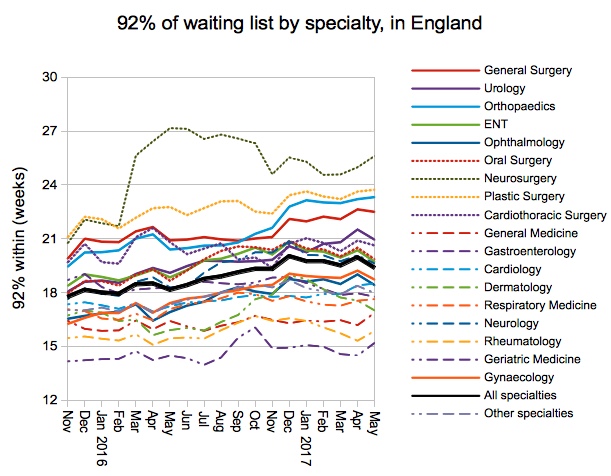
Surgical specialties tend to have longer waits, and they improved slightly in May. Medical specialties tend to have shorter waits, and they got slightly worse.
Local detail
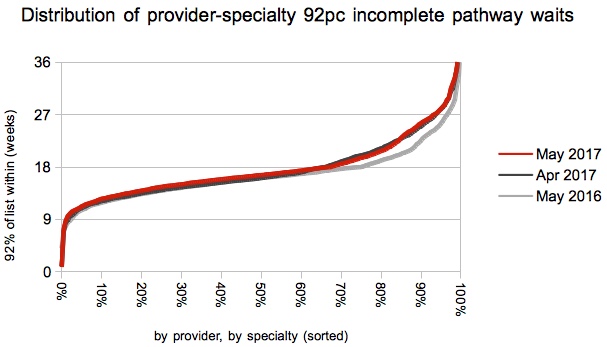
The proportion of local specialties achieving the 18 week target improved slightly in May, in line with the overall picture.
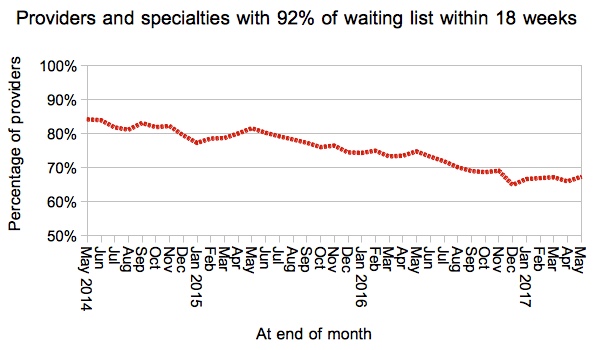
Over the month, the shift was for short waits to get a little longer, and long waits to get a little shorter. But if you go back a year, the trend is for long waits to have grown substantially, while short waits have remained unchanged.
We’ve also done some interactive maps showing the waiting times position by specialty for every Trust and CCG with significant waiting lists. If you want to look your own Trust up quickly, then visit our 18-weeks reports page.
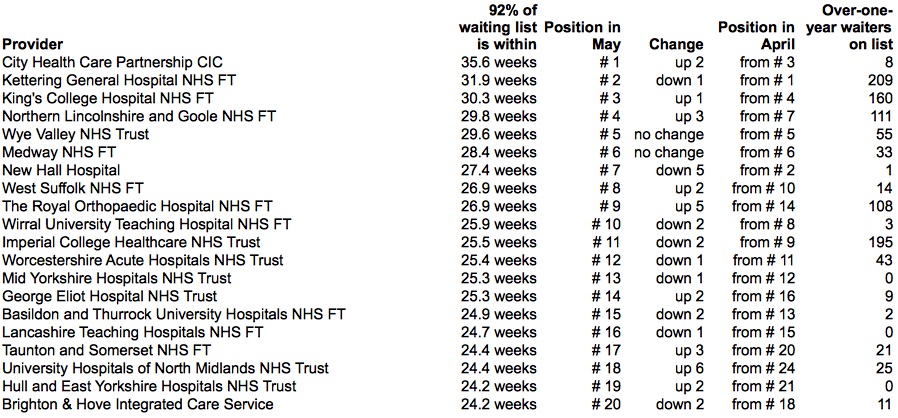
City Health Care Partnership CIC moved up to the top of the long-waits table in May. They were previously known as NHS Hull provider services and their waiting list is much smaller than a typical NHS trust’s at only 1,580 patients.
Kettering General Hospital NHS Foundation Trust slightly improved their waiting times over the month, but they are still reporting more over-52-week waiters than any other trust.
Perhaps they could draw some encouragement from University Hospitals of Leicester NHS Trust? Back in January 2016, Leicester had a whopping 269 over-52-week waiters on their waiting list, and congratulations are due for bringing that down to just 9 in the latest figures.
Data for June 2017 is due out at 9:30am on 10th August.