

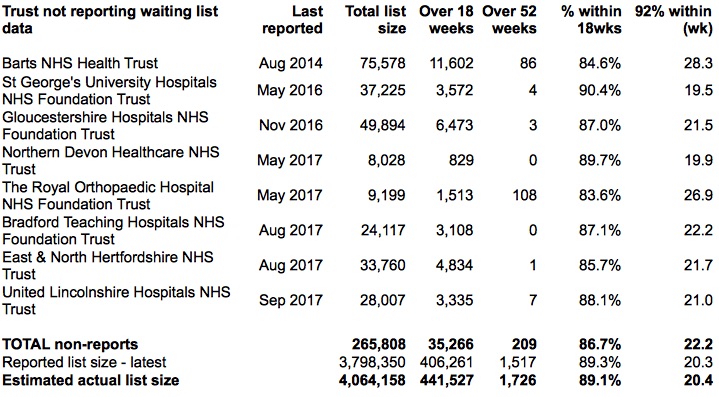
An estimated 266,000 patients are missing from the officially reported waiting list, which is the highest figure ever recorded and beats the previous record of 263,000 set in April 2015. This means that an estimated 6.5 per cent of the national waiting list is currently not being declared, based on the last known positions at non-reporting trusts.
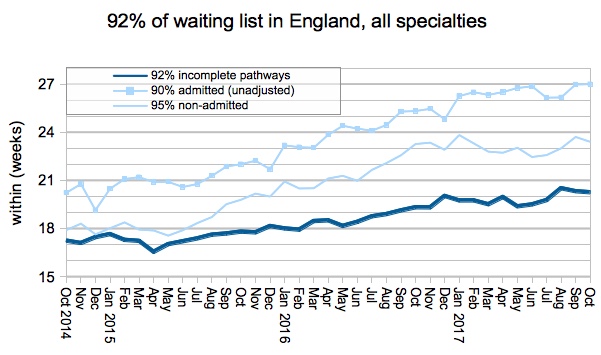
Based on the figures that were reported, elective waiting times stayed above 20 weeks for the third month in a row in October, continuing a run of national 18-week target breaches that has been going on since March 2016.
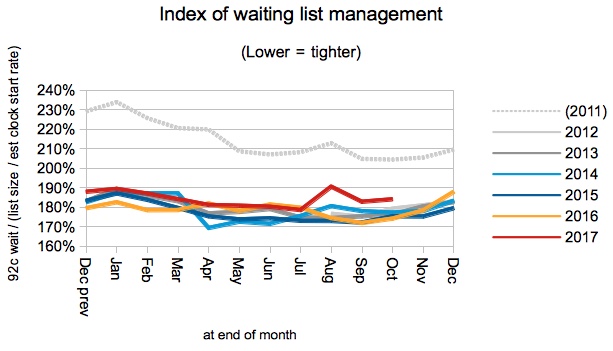
These long waiting times are fuelled mainly by the sheer size of the waiting list (which in turn is linked to continued shortfalls in the numbers of patients being admitted for treatment), and also by slippage in waiting list management around the country.
For analysis of waiting times performance at a particular organisation, visit our reports page. You can also access maps of the latest waiting times across England for A&E, cancer, and RTT.
In the following analysis, all figures come from NHS England. If you have a national statistic that you’d like to check up on, you can download our RTT waiting times fact checker.
England-wide picture
Waiting times remained steady above 20 weeks in October.
In August there were five non-reporting trusts. By the end of October the number had risen to eight, with United Lincolnshire Hospitals NHS Trust stopping reporting during October because of problems with a PAS upgrade.
If you add the last known positions at non-reporting trusts back into the data, there are nearly 4.1 million patients waiting. This is not yet a record – the first referral-to-treatment waiting list ever reported, back in August 2007, had 4,187,398 patients waiting. On previous seasonal trends that record may not be broken until next spring.
The reported figures make it look as if the waiting list shrank in September and October, but unfortunately this is an artefact of three trusts taking reporting holidays. If you add the last known positions of non-reporting trusts back in, then the waiting list remained pretty flat.
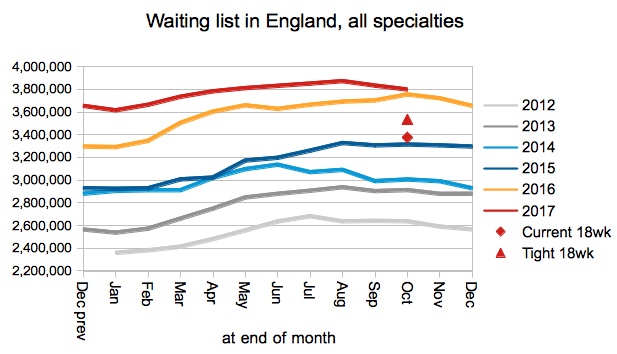
In the chart above, the red diamond estimates the list size that would achieve 18 week waiting times, on the basis of current waiting list management. However (as the chart below shows) waiting list management deteriorated in August.
So it would be interesting to know how much more easily 18 weeks could be achieved if waiting list management improved again, and this is what the red triangle shows above – it is based on tighter waiting list management, in line with the performance that was fairly consistently achieved from 2013 to 2016.
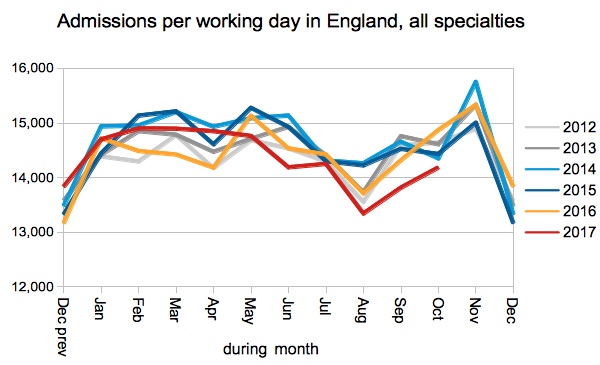
Admissions per working day remained lower than in recent years, and this is contributing to the growing waiting list.
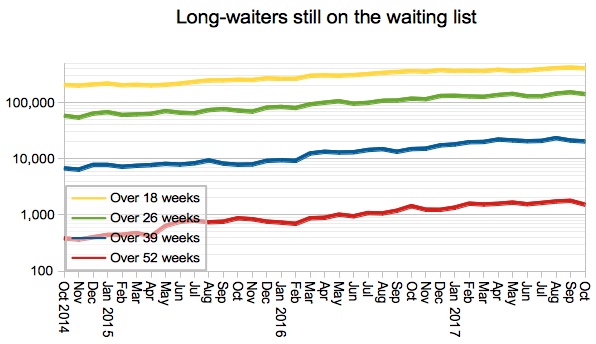
The number of one year waiters fell slightly from 1,778 to 1,517 which is the lowest reported figure since January. But before anyone gets too excited about this, let’s remember there were just 214 one year waiters in November 2013, and the long term trend is very much in the wrong direction.
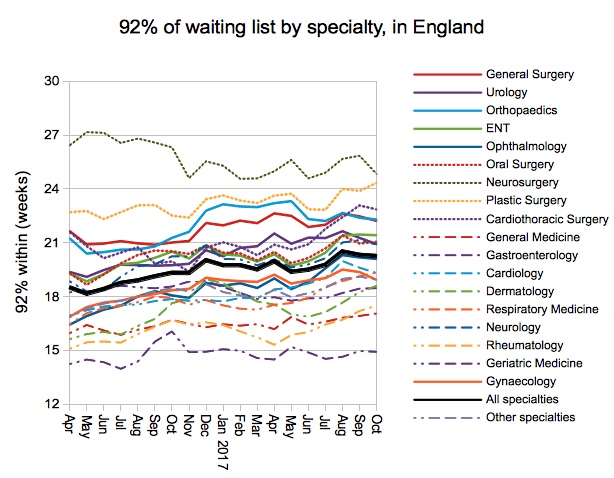
It was a mixed picture at specialty level, with some improvement in long waiting specialties and deterioration in shorter-waiting specialties. Only 3 specialties are still achieving 18 weeks at national level and they are all in medicine.
Local detail
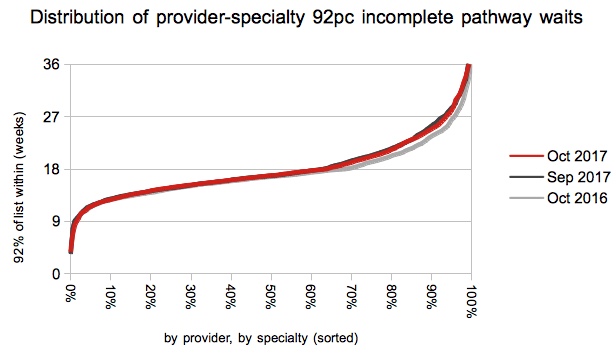
The proportion of local services achieving 18 weeks improved slightly…
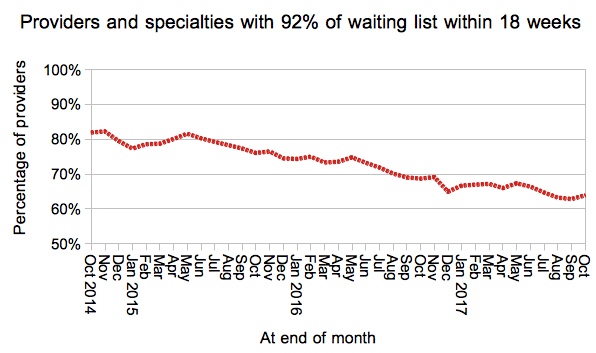
…and we can see in the distribution below that the benefits were mainly felt at the longer-waiting end of the distribution (although the change was quite small). The value plotted in the chart above is where the red line crosses 18 weeks in the chart below.
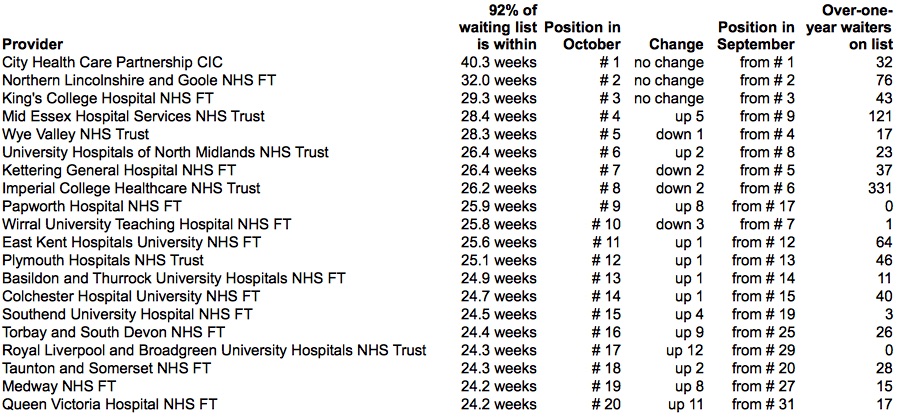
There are a few new entrants at the bottom of this month’s top twenty, with only modest reshuffling towards the top.
Data for November 2017 (and revisions for April to September 2017) are due out at 9:30am on Thursday 11th January 2018. Have a merry Christmas and a happy New Year.