
Forget about 18 weeks – those days are long gone. As I predicted last year, England’s referral to treatment waiting times topped 20 weeks in December according to the latest figures.
That’s the worst performance since March 2011. In case you can’t remember that far back, the “incomplete pathways” target wasn’t even announced until several months later, in November 2011. So the English NHS has well and truly returned to the pre-target age.
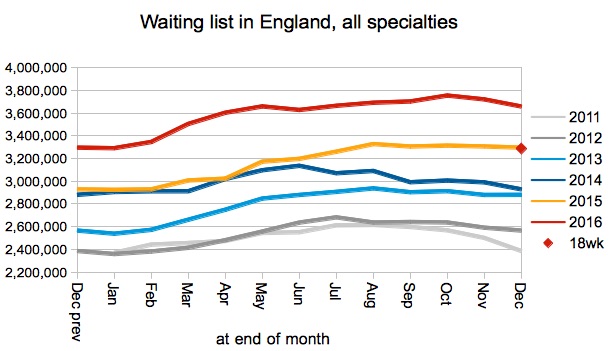
The main driver of long waits at the moment is the sheer size of the national waiting list, which is now so big that it would have to return to last year’s level before 18 weeks became achievable again.
Other measures got worse as well. The proportion of local specialties achieving 18 weeks dipped sharply, with the biggest deterioration seen in longer-waiting services. And the shape of the English waiting list loosened a little too, to the worst December performance in five years.
As usual, in the following analysis, all figures come from NHS England. If you have a national statistic that you’d like to check up on, you can download our RTT waiting times fact checker.
England-wide picture
Waiting times ticked up in December, as they usually do as winter starts to bite. I am expecting waiting times to stay above 20 weeks until February or March 2017, then fall below 20 weeks for a while, and then exceed 20 weeks permanently from around August 2017.
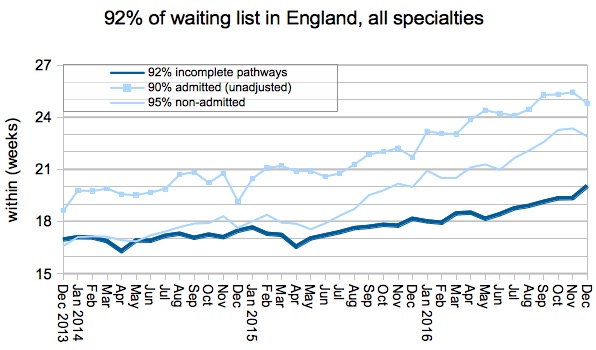
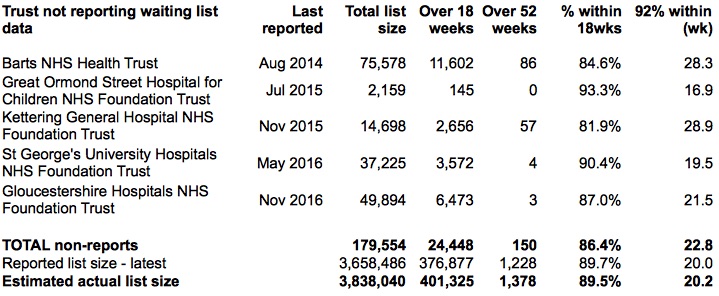
Let’s look at non-reporting trusts for a minute. Gloucestershire Hospitals NHS Foundation Trust have stopped reporting, but Wye Valley have resumed (and well done them). If you add in the last-known positions of non-reporting trusts then English waiting times reached 20.2 weeks in December.
As I said above, waiting times are currently driven mainly by the size of the English waiting list. To achieve 18 weeks again, the waiting list would need to shrink back to the size it was a year ago.
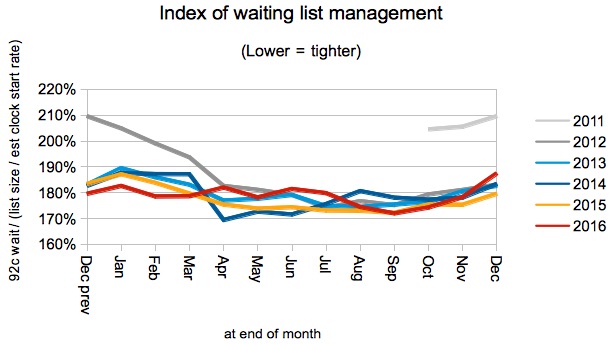
The other influence on waiting times is the order in which patients are treated from the waiting list. This remains broadly steady within seasonal variation (winter pressures usually push waiting times up a bit), although by a small margin the waiting list shape was the worst of any December since 2011.
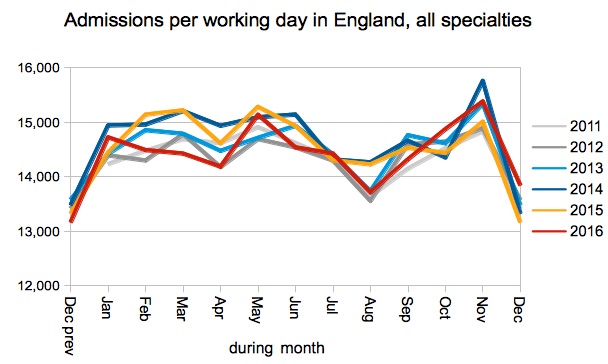
Admissions per working day were slightly higher than in recent Decembers, which is at odds with NHS Improvement’s quite specific instructions to reduce elective activity during winter, to release beds for emergency patients. My guess is that trusts sensibly replaced lost inpatients with increased daycases.
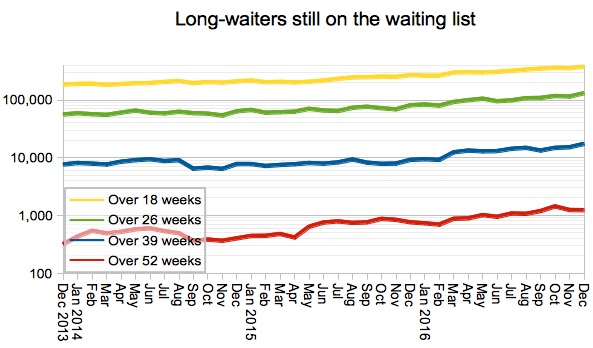
The number of one-year waiters was roughly steady at 1,228, although there will be plenty more at non-reporting trusts. It is worth remembering that as recently as November 2013 there were only 214 one-year waiters, and in August 2014 the Secretary of State for Health, Jeremy Hunt, declared “no-one should have to wait more than a year for treatment”. What a shame that has all been frittered away.
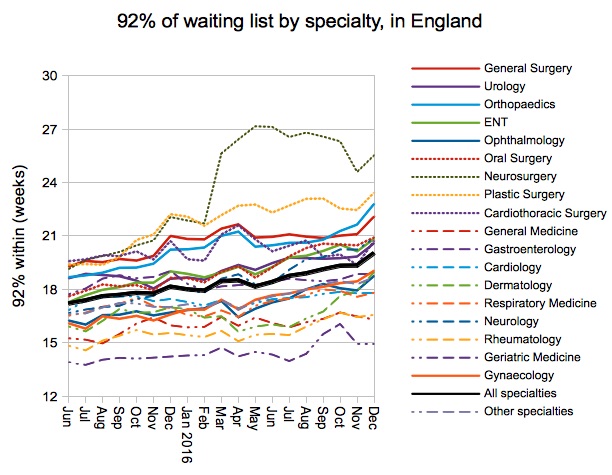
All surgical specialties are well above 18 weeks now, with the shortest surgical waits in Ophthalmology at 18.8 weeks, and the longest in Neurosurgery at 25.5 weeks (and rightly highlighted by the Royal College of Surgeons).
Local detail
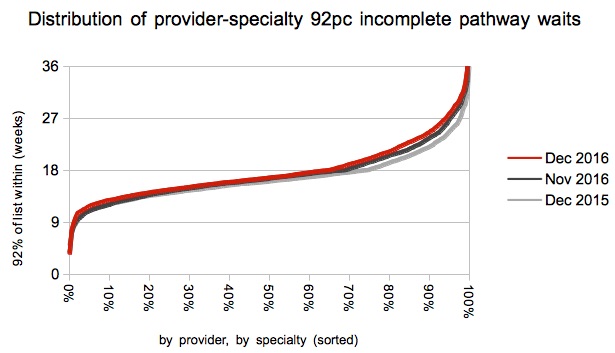
Turning now to the 2,500-odd local specialties within providers that have reasonable volumes of waiting list patients, there was a sharp drop (from 69 to 65 per cent) in the proportion of local services achieving the 18 week incomplete pathways target.
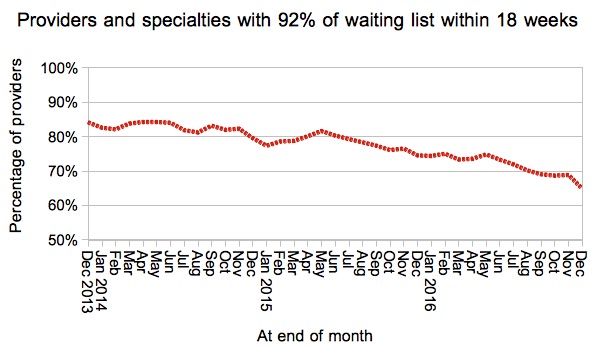
The chart below shows why. Lots of local services have waiting times just inside the 18 week target. As those waiting times creep up, the point where the red line crosses 18 weeks moves quite rapidly leftwards.
To make things worse, the biggest increases in waiting times were in those services that have already breached the target, which could indicate that waiting times management takes a turn for the worse when 18 weeks is no longer sustainable.
We’ve also done some interactive maps showing the waiting times position by specialty for every Trust and CCG with significant waiting lists. If you want to look your own Trust up quickly, then visit our 18-weeks reports page.
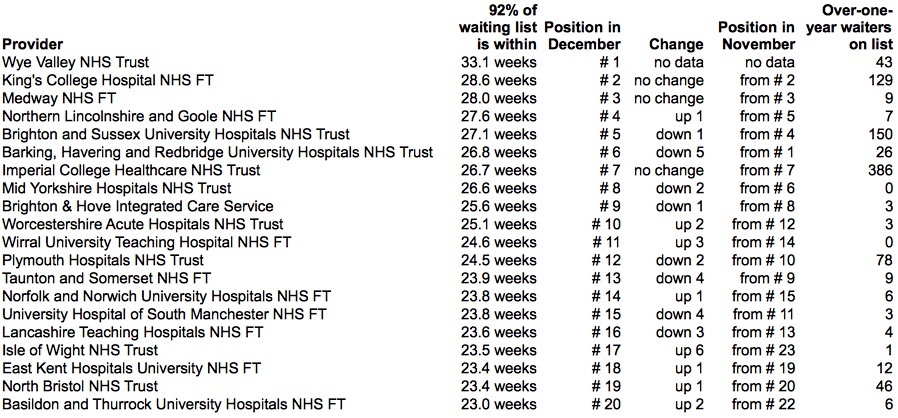
Wye Valley NHS Trust has started reporting incomplete pathways data for the first time since March 2015, so well done them. They have jumped straight in at the top of the table, which is not unusual when a trust has recently experienced severe difficulties with its data. I look forward to seeing them improve over the coming months, as other trusts have done following their return to reporting.
Data for January 2017 is due out at 9:30am on 9th March (the second Thursday of the month).