
Financial penalties for breaching the ’18 week’ referral-to-treatment (RTT) waiting times targets were lifted back in March, giving RTT waiting times a lower priority than financial balance, A&E waits, and cancer waits. Shortly afterwards I noted:
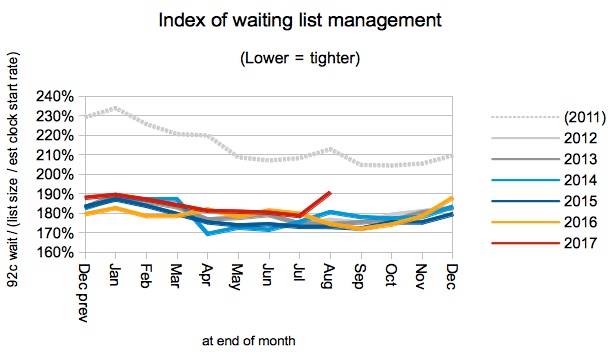
I would also expect [the waiting list management] index to be quite sensitive to the level of importance attached to RTT waiting times. If the lifting of financial penalties in March leads to a loss of focus, then a rise in this index might be the first clear sign.
It didn’t happen immediately. But it has now.
Waiting list management improved dramatically across England when the incomplete pathways target was introduced in 2012. All those gains have since been held, until now – the latest figures show a sharp deterioration in waiting list management during August, which suggests for the first time that the NHS has started loosening its grip on RTT waiting list management and on waiting times.
Grip can be loosened quickly, but it can be tightened quickly too. If the NHS wants to avoid runaway RTT waiting times then focus needs to be returned to good patient scheduling. This costs nothing beyond management time – however with the higher priorities of finance and A&E proving very tough indeed, management time is a scarce resource.
In the following analysis, all figures come from NHS England. If you have a national statistic that you’d like to check up on, you can download our RTT waiting times fact checker.
England-wide picture
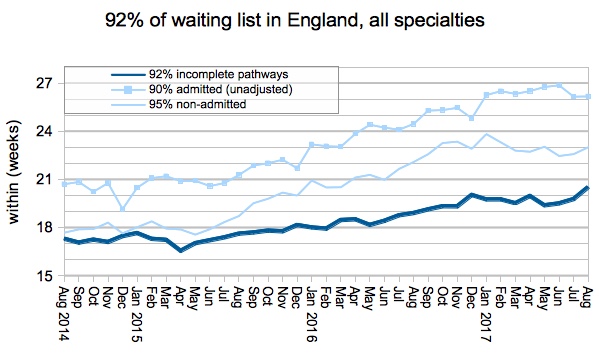
The headline measure shows that waiting times have jumped to 20.5 weeks on the official figures, which is the worst performance since March 2011. The steady increase so far has been caused mainly by the growing waiting list – but not when it comes to the August figures, as we shall see.
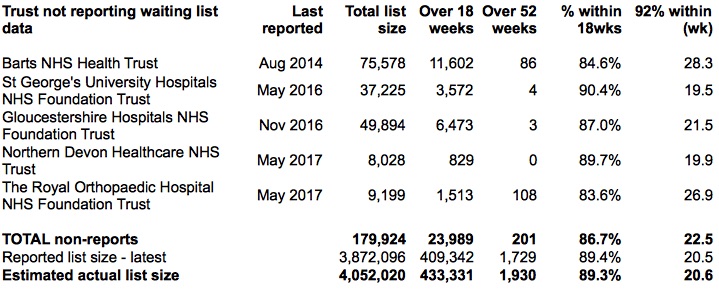
Before we go on, let’s take a quick look at the effect of non-reporting trusts. The list of non-reporters is the same as last month, and if you factor in their last known positions then the size of the waiting list rounds to 4.1 million. This is closing in on, but has not yet reached, the largest RTT waiting list ever recorded (in the very first data collection back in August 2007).
To their credit, the NHS England statisticians have now started publishing an RTT time series that is adjusted throughout for non-reporting trusts.
Returning to the as-reported data, the waiting list crept up in August as it often does at this time of year. Year-on-year growth in the waiting list continues to be a problem, but this month it was not the main problem.
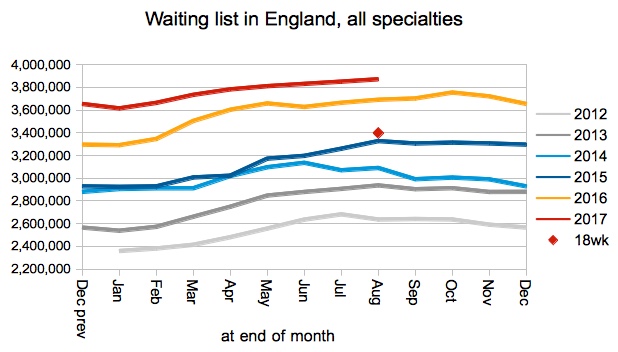
Waiting times are a function of two things: the size of the waiting list, and the order in which patients are treated (also referred to as patient scheduling or waiting list management). We know this from our everyday experience – a longer queue means longer waits, and queue-jumpers make you wait longer.
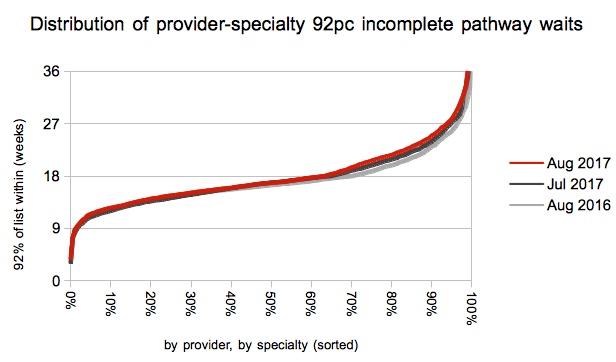
Since 2012 the waiting list has been steadily growing, leading to steadily rising waiting times. But waiting list management has remained stable with only seasonal variation. Until now, that is. The August index shows a clear rise above the pattern of recent years, and this indicates unmistakably that something has changed.
But what? This is an England-wide figure, so it is a composite of several different things. Firstly, how disciplined patient scheduling is in each local waiting list. Secondly, how well resources are being allocated within trusts in order to even out waiting time pressures. Thirdly, how well resources are allocated between trusts.
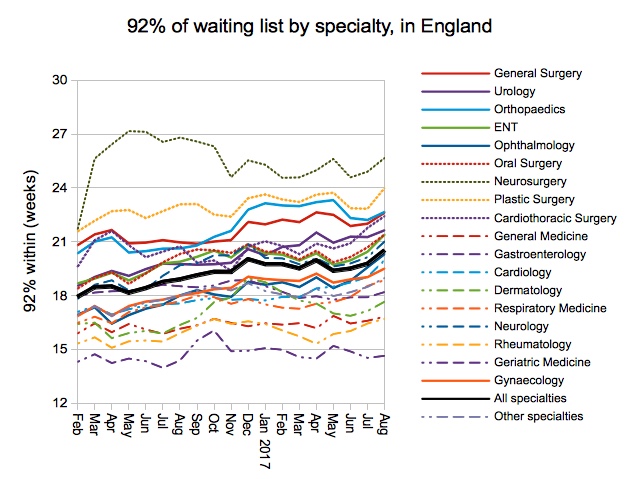
In this case I expect that the first – looser patient scheduling – would explain nearly all the change seen in August. Patient scheduling can change almost overnight if management eyes are taken off that particular ball, and this is a very rapid change indeed. In contrast, demand and resource allocation shift relatively slowly, both within and between trusts, and the specialty-level waiting times chart (shown further below) shows that all the major waiting list specialties have been affected similarly.
So we have a sharp deterioration in waiting list management, and evidence that this is not caused by a sudden change in imbalances between specialties. That is why I think this is evidence of the English NHS relaxing its grip on RTT waiting times, following the lifting of financial penalties back in March.
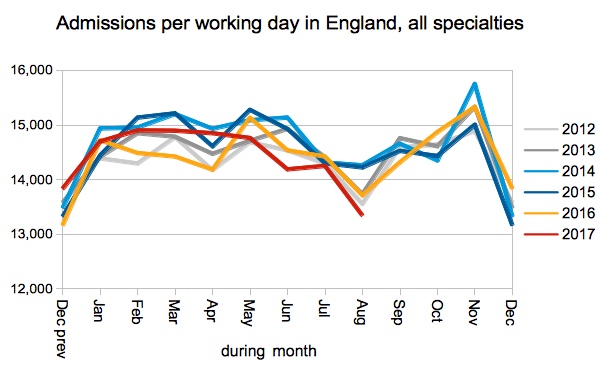
Admissions per working day were also down, to the lowest August level in many years. This contributes to the steadily rising waiting list which is the harder-to-solve part of rising waiting times.
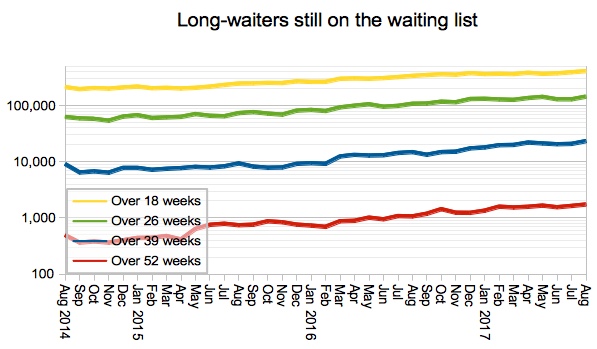
Very long waits continue to rise, and the number of one-year-waiters on the waiting list is now the largest since August 2012.
As mentioned above, all major waiting list specialties were affected by this sharp lengthening of waiting times, suggesting that resource allocation between specialties is not the explanation for the change in the index of waiting list management.
Local detail
The proportion of local specialties achieving the 18 week target slipped again, consistent with the overall picture.
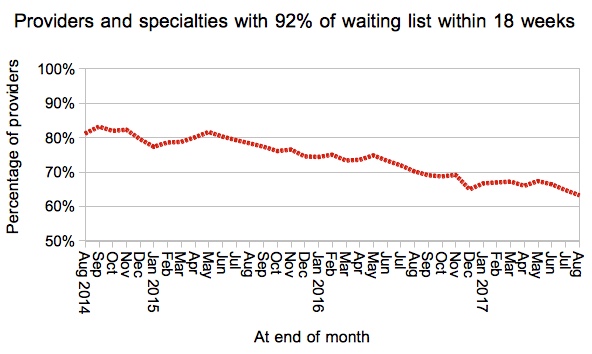
This was fuelled mainly by a sharp deterioration in those local services that already had long waits.
We’ve also done some interactive maps showing the waiting times position by specialty for every Trust and CCG with significant waiting lists. If you want to look your own Trust up quickly, then visit our 18-weeks reports page.
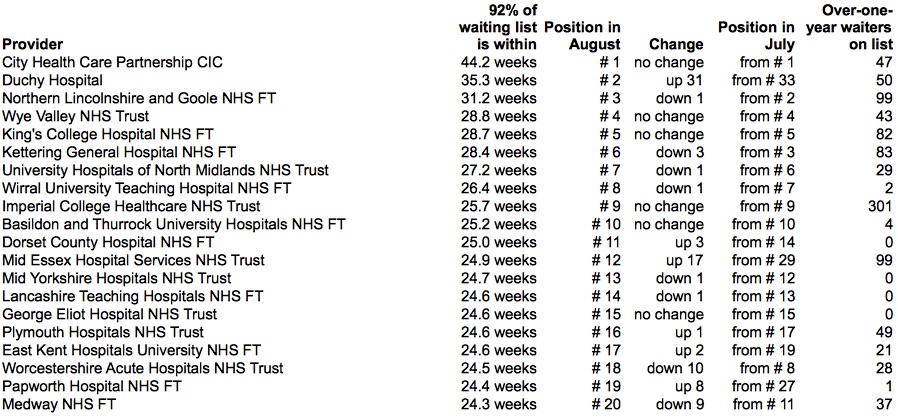
Looking now at those trusts with the very longest waiting times, independent providers take the top two slots again and both have featured in this table before in recent months. Other than that there was little change, except for the sudden appearance of Mid Essex Hospital Services NHS Trust who have appeared on the table with 99 one-year waits following the implementation of a new IT system.
Data for September 2017 is due out at 9:30am on Thursday 9th November.