

We released a major upgrade to Gooroo Planner on 4th November 2014, which is available now to all Gooroo Professional and Planner API users at no extra cost.
The centrepiece is a suite of new patient-level upload options, which make it much easier to create and update comprehensive capacity models, especially around week-by-week planning and theatre capacity. (And rest assured that all your existing statistical datasets will carry on working as normal.)
This means that if you haven’t got around to automating your capacity planning yet: congratulations, your job just got a lot easier. Already one analyst (who had never seen Gooroo before) has prepared ready-to-automate capacity plans in a single day using the upgraded software, covering the entire hospital at subspecialty level with week-by-week plans for activity, waiting times, beds, clinics and theatres.
Why patient-level data?
Let’s just clear one thing out of the way first: if your information governance antennae are twitching, then relax. No patient identifiers are involved.
So here is the problem we wanted to solve.
The data that Gooroo Planner uses in its calculations is all statistical, and until now you had to load the data directly in that statistical form. The problem is that hospital IT systems tend to be structured so that different bits of data come from different places, so there was quite a lot of work involved in stitching it all together. Even if you ignore the split between inpatient and outpatient systems, it’s all a bit of a tangle, and that tangle means work for an information analyst to stitch it all together.
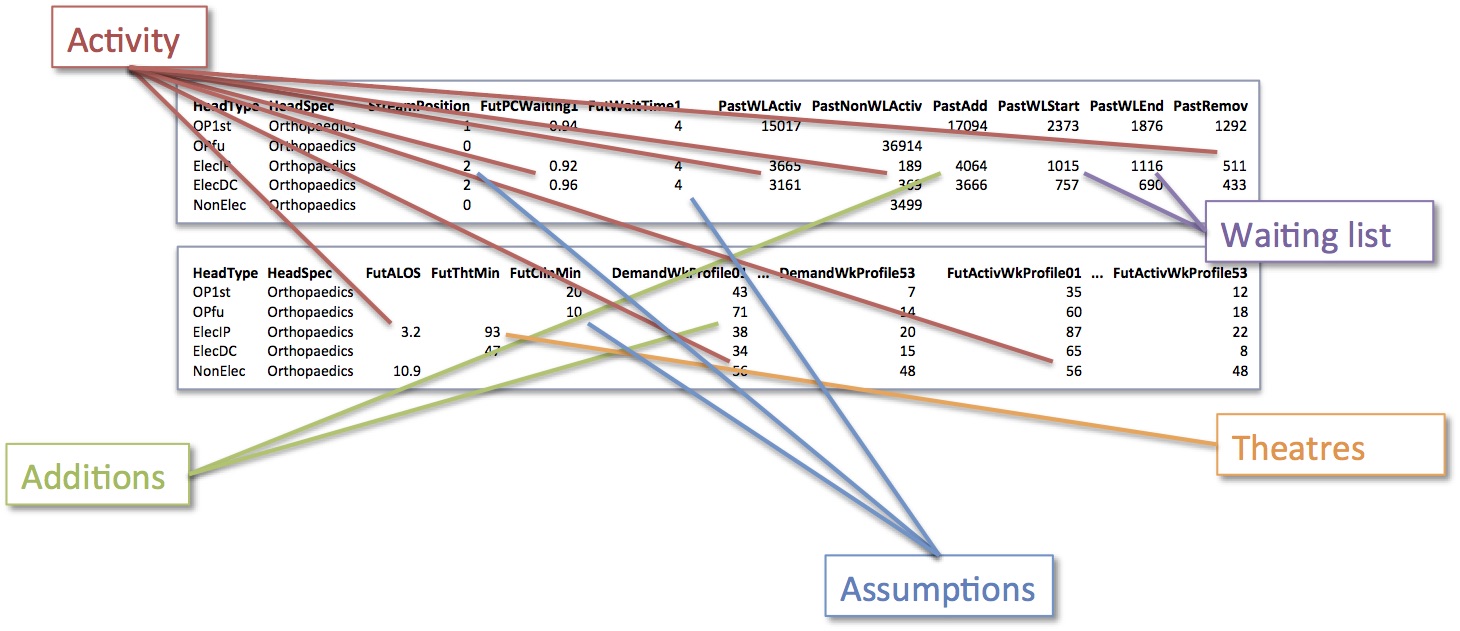
Statistical data comes from various sources
The new upgrade means that you don’t need to stitch the data together yourself: you can just throw it in, in any order, and let Gooroo Planner analyse it and stitch it all together for you; no matter whether you’re modelling your capacity on-screen, or automatically using the Planner API.
The other issue is that some of the numbers are rather fiddly to work out. Even something apparently simple, like breaking activity down by calendar week, gets complicated when you want to average over several years, avoid part-weeks at the start and end of the data series, and adhere to the ISO8601 calendar standards.
Theatre data is also relatively complex to analyse, especially when you need important performance measures such as theatre utilisation. Working out overall utilisation for a physical theatre is relatively simple, but when you want it broken down by specialty or subspecialty, and split between inpatients and daycases, it gets much more difficult because sessions often contain a mix of patients from different service lines. It’s difficult enough that, as far as we know, nobody in the NHS ever got as far as working it out.
So we’ve taken care of all that complexity for you.
There’s something else we want to do, which is to get deeper into the statistics of variation, and to integrate SimActive into Planner so that you can access detailed waiting list analysis with just one click. Patient level data makes all of that possible for the future too.
How you can use it
Let’s say your inpatient data is kept on a different system from your outpatient data, and theatre data is somewhere else again. Additions to the waiting list are kept separately from activity, and waiting list snapshots are separate too.
On top of that, you have a collection of performance assumptions that operational managers prefer to use in place of past performance, and there are also a few general assumptions that you want to throw in on top.
No problem. Now you can just upload it all like this:
- Initial data upload: patient level activity from inpatient PAS.
- Update: patient level activity from outpatient PAS (creating new records).
- Update: patient level additions.
- Update: patient level waiting list snapshots (x2 or x3).
- Update: patient level activity from theatres.
- Update: statistical data with service managers’ performance assumptions (which is allowed to overwrite what it already there).
- Update: statistical data with high level assumptions.
To see how much easier the new process is, let’s go through with some simple examples of each table.
The initial upload (in this example) uses a patient-level inpatient file, containing headers that place the patient in the right service, their urgency (e.g. cancer, other urgent, or routine), whether they are a waiting list patient, whether they were activity or a removal for other reasons, and their length of stay. This patient-level list is much easier to create than all the detailed statistics around activity, activity profiles, urgency and removal rates, etc that was required before.
(As always, all the fields are documented in Planner: calculations and data.)
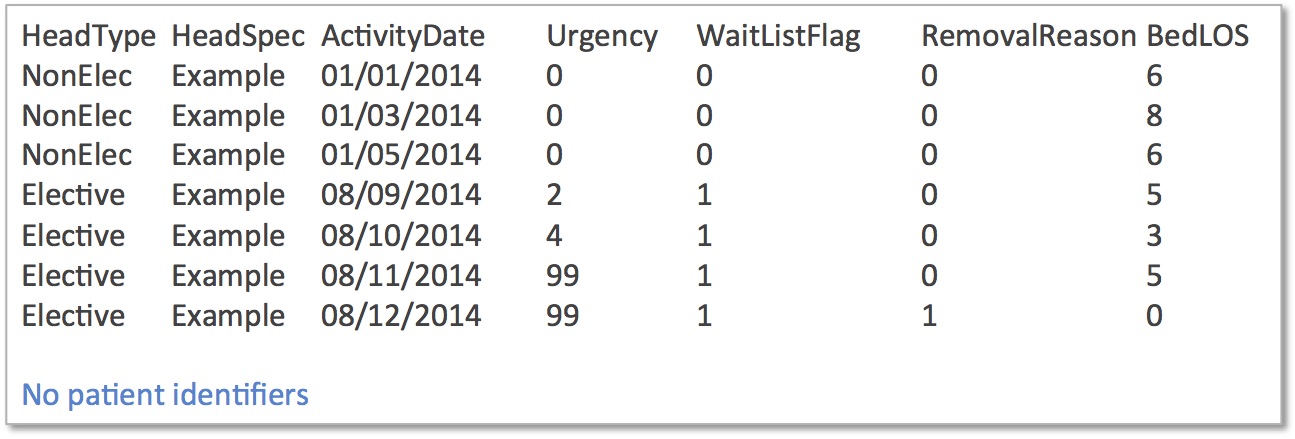
Patient level activity from inpatient PAS
This first file gets the dataset started, and then we use Update to throw everything else in on top. (When you automate this with the Planner API, you just add one table after another in the same API call.)
The second table is outpatients activity, and we need to remember to tell the system to allow the new outpatient records to be created. The format is the same as for inpatients, and it might look something like this:
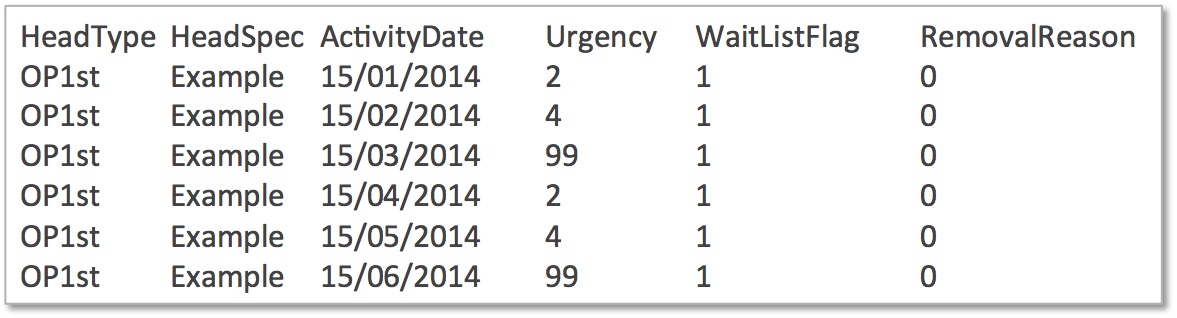
Patient level activity from outpatient PAS
The patient level additions table is the simplest of the lot, and it allows the overall additions and weekly demand profiles to be calculated.
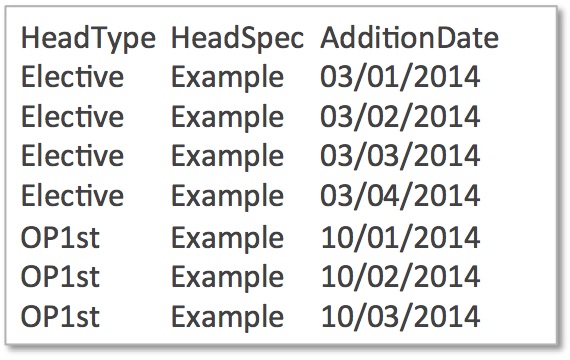
Patient level additions
The next file is waiting list snapshots, and you can either throw in a mix of snapshots in a single file, or load each snapshot separately; it’s up to you. Planner will try to match the census dates of the snapshots with the dates of the start and end of the past period, and the start of the future period (and it allows a 7 day tolerance either side of month end when doing that).
For the purposes of Gooroo Planner, you only need to enter the first three columns of data. But it’s a good idea to load the other data up too, so that you can also use the patient-level waiting list simulations that are now integrated into Gooroo Planner.
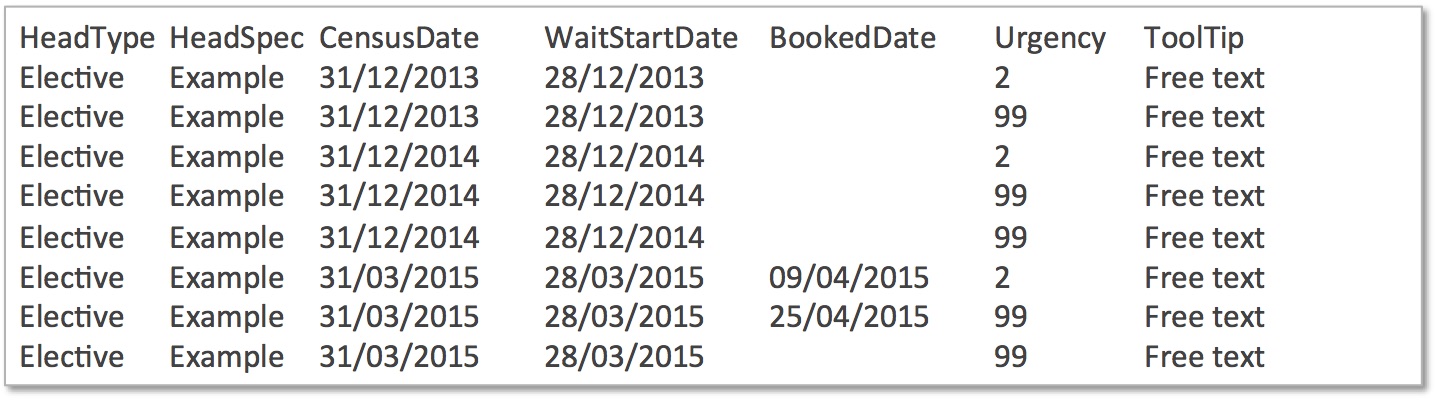
Patient level waiting list snapshots
The last of the patient level files in this example comes from the theatre system. This is all you need to get a comprehensive and detailed set of theatre performance data including average times in theatre, utilisation, availability, and proportion of weeks worked.
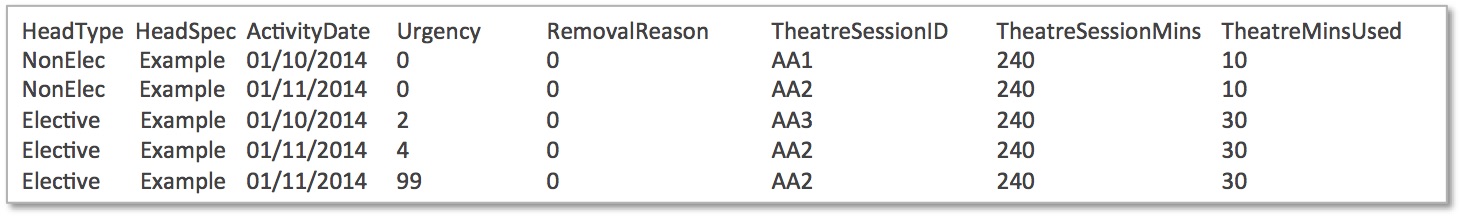
Patient level activity from theatres
Next we turn to the statistical data that we want to throw in on top. There is an important new role for information professionals in gathering and curating all the performance assumptions that operational managers want used in your organisation’s capacity planning, and we have now reached the point where you can throw that table in. You’ll want to tell Update to overwrite any numbers that are already there from the earlier data.
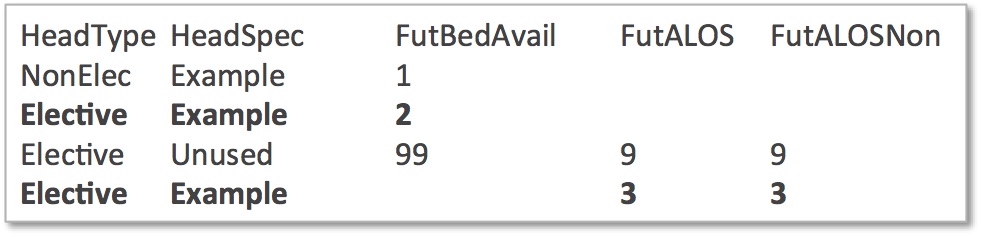
Statistical data with service managers performance assumptions
You’ll notice that I’ve picked out two lines in bold, and they are actually the same service. This wasn’t allowed before, but it is now, and the rule is that if the same data for the same service appears more than once, then the last occurrence is the one that is used. In this example, the service in bold will get FutBedAvail=2 and FutALOS=3. If there had been figures for FutALOS in the first bold row, they would be overwritten by the values in the second bold row.
Finally, we chuck in a few high-level assumptions, such as a 6 week wait for all outpatients and an 8 week wait for all electives.
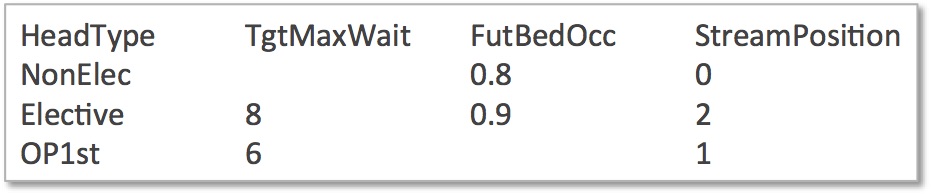
Statistical data with high level assumptions
Controlling how data is used
You can control which time periods are used to filter the patient-level data for different purposes, so that everything is used in the way you want. The three time periods you need to be aware of are:
- past period and future period (which have the same meanings as before)
- performance period (over which performance measures are taken)
- whole data period (spanning the entire data file you are using)
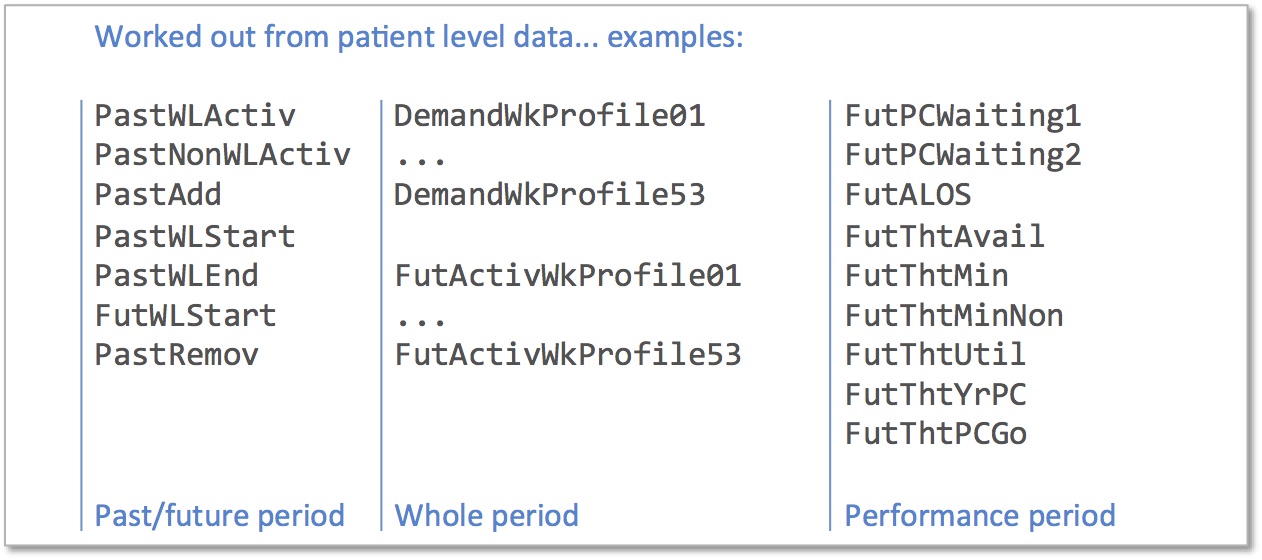
Time periods
So you might want the past period to be the last 12 months, but measure performance over the last 2 years, and average the weekly profiles over the last 3 years. That’s easy to do with a single patient-level file: just upload 3 years worth of data, and set the past and performance periods accordingly.
Automated capacity planning
The Planner API has been upgraded to include all the functionality described above when running Gooroo Planner automatically without human involvement.
Other minor tweaks
We fixed a few other things in this upgrade while we were at it. The one you’ll find most useful is that the weekly and monthly profiling data now includes the number of long-waiting patients over target (and that’s included in the Planner API results too).
Also: a lot of the main upload and update software has been rewritten to improve stability and performance.
Support
Documentation is available in the revised Planner: calculations and data document, and there will be a training video along at some point too.
If you need any help with the upgrade, with automated capacity planning using the Planner API, or with anything else at all in Gooroo, then get in touch by emailing [email protected]. Gooroo licences come with unlimited remote support so do make the most of it.