

The latest referral-to-treatment (RTT) waiting time figures show the closing position for the last Conservative government, and the inheritance for Labour. The picture could be summarised as dreadful but no longer getting worse.
Analysis produced for Health Service Journal by Dr Rob Findlay, Director of Strategic Solutions at Insource Ltd and founder of Gooroo Ltd
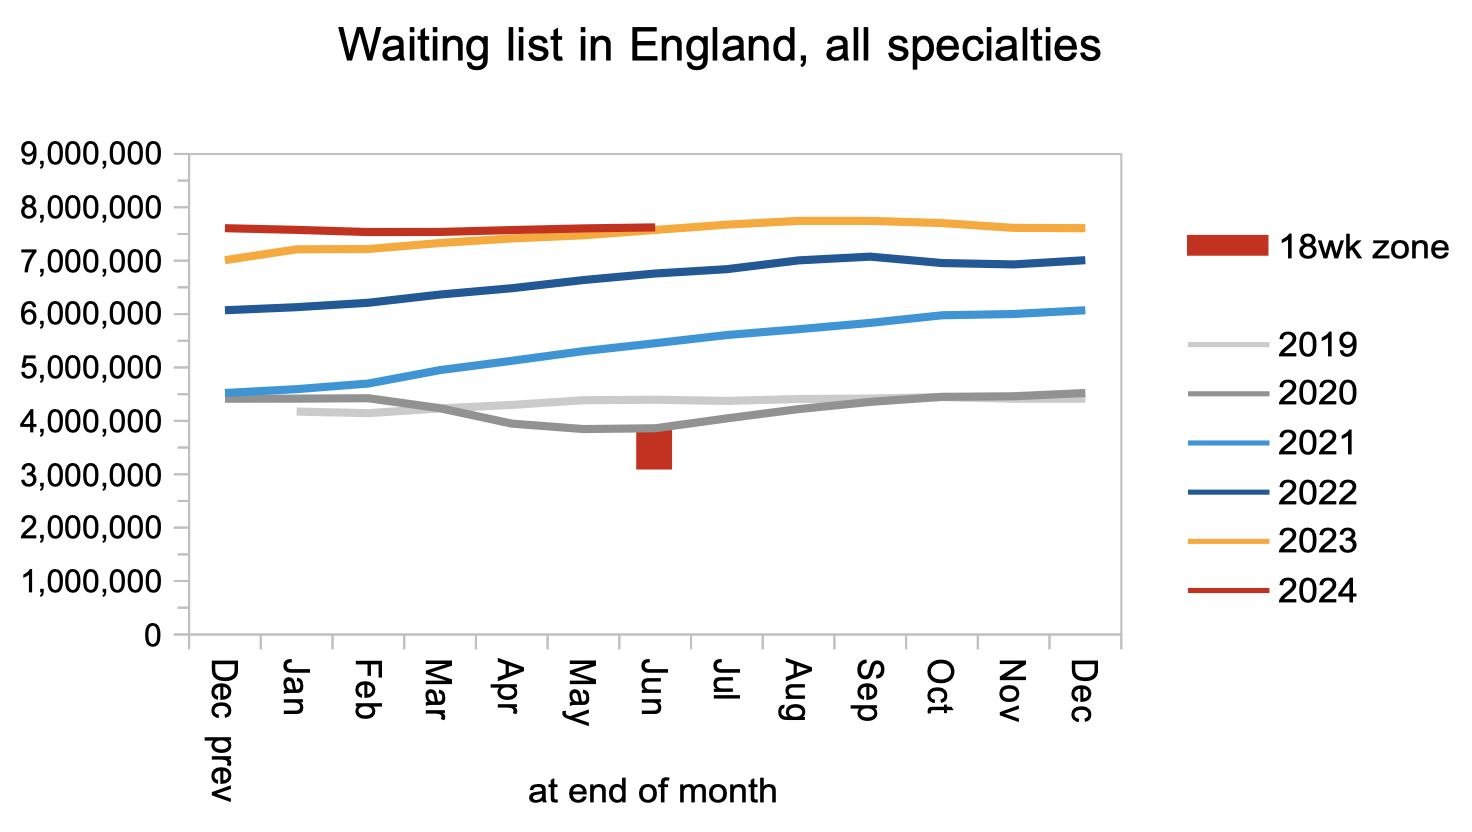
In June, the reported English RTT waiting list grew by 20,000 patient pathways to 7.62 million, which is not what the last prime minister promised but a lot better than the rapid growth of recent years. However the reported list may be an underestimate, because of overdue ‘planned’ patients not being properly reported.
The NHS is currently trying to eliminate ultra long waits, although those targets will (I hope) soon be subsumed by the incoming government’s ambition to restore the statutory 18 week standard by 2029. In June, the number of over-104-week and over-78-week waits roughly halved, to 120 and 2,621 respectively, which is good. The next target deadline is to eliminate 65 week waits by September, but numbers increased by 2,000 to 58,000.
In the following discussion, all figures come from NHS England. You can look up your trust and its prospects for achieving the waiting time targets here.
The numbers
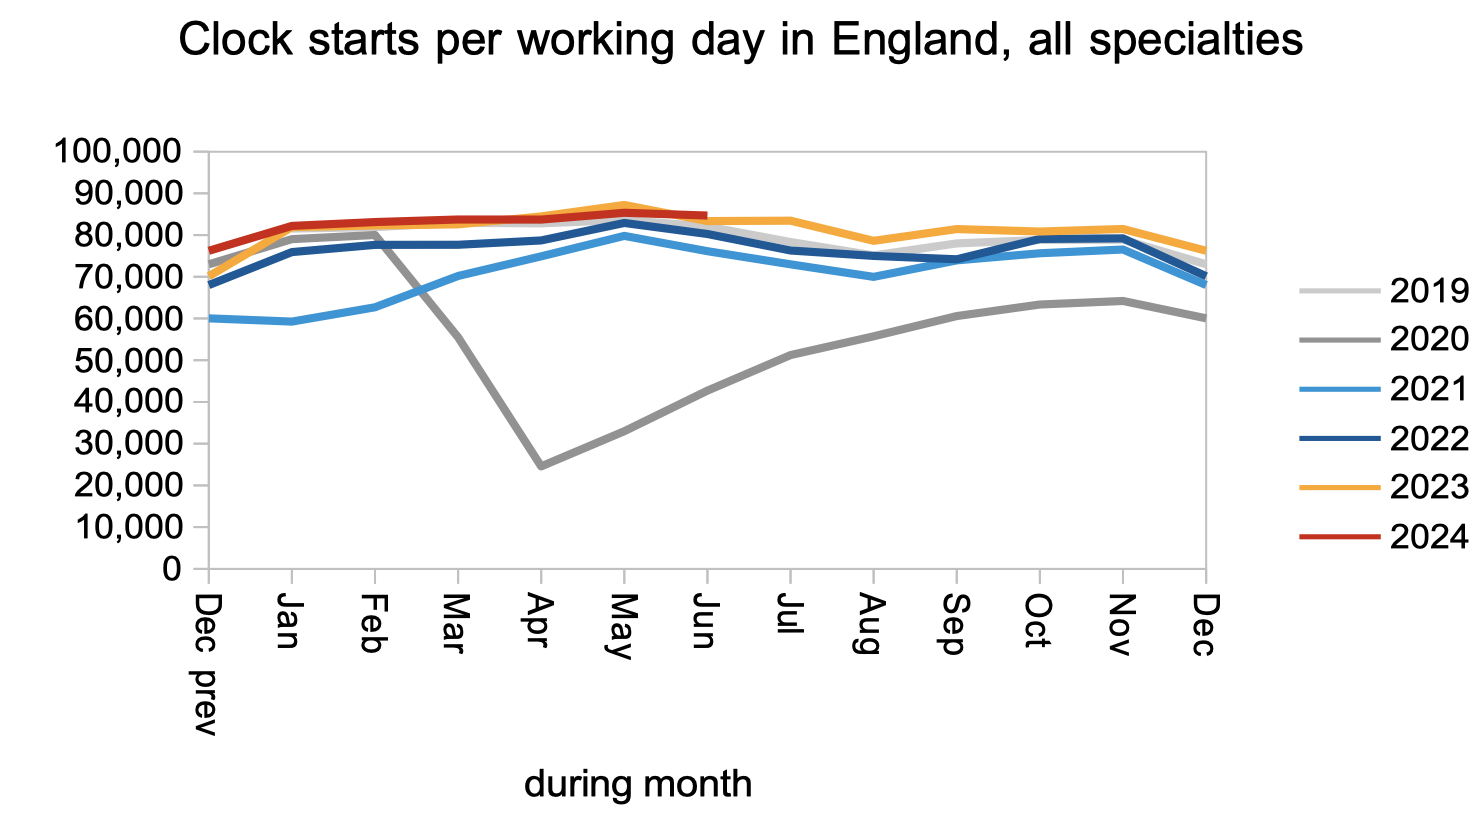
Demand remained steady and close to pre-pandemic rates, as measured by the number of patients starting new RTT waiting time ‘clocks’.
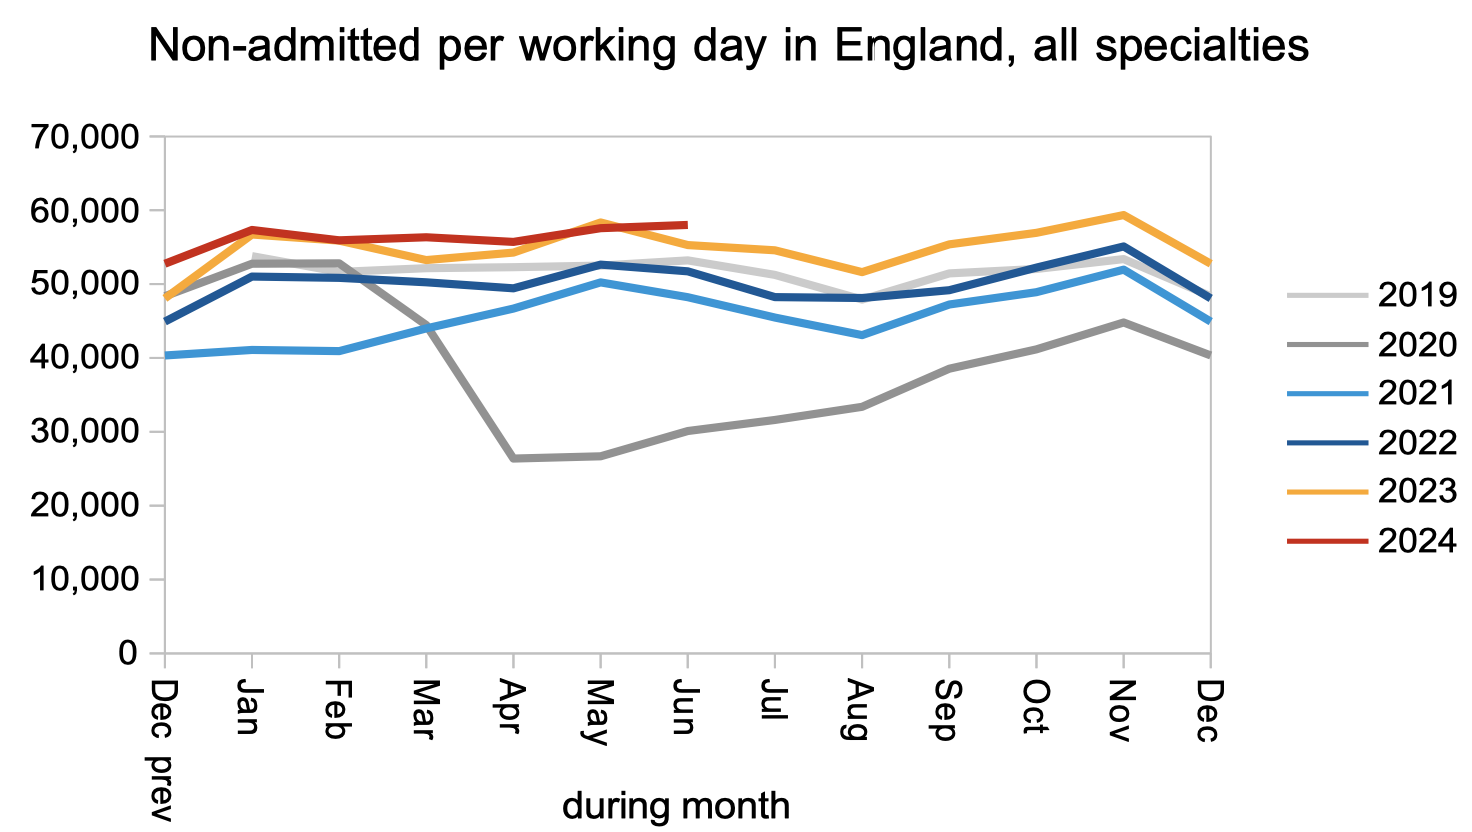
The rate of patients being treated and discharged from clinic was slightly higher than last year, and significantly higher than before the pandemic. This is good: outpatients and diagnostics are where the sheer numbers are waiting, and there is clinical risk associated with keeping patients waiting without a diagnosis.
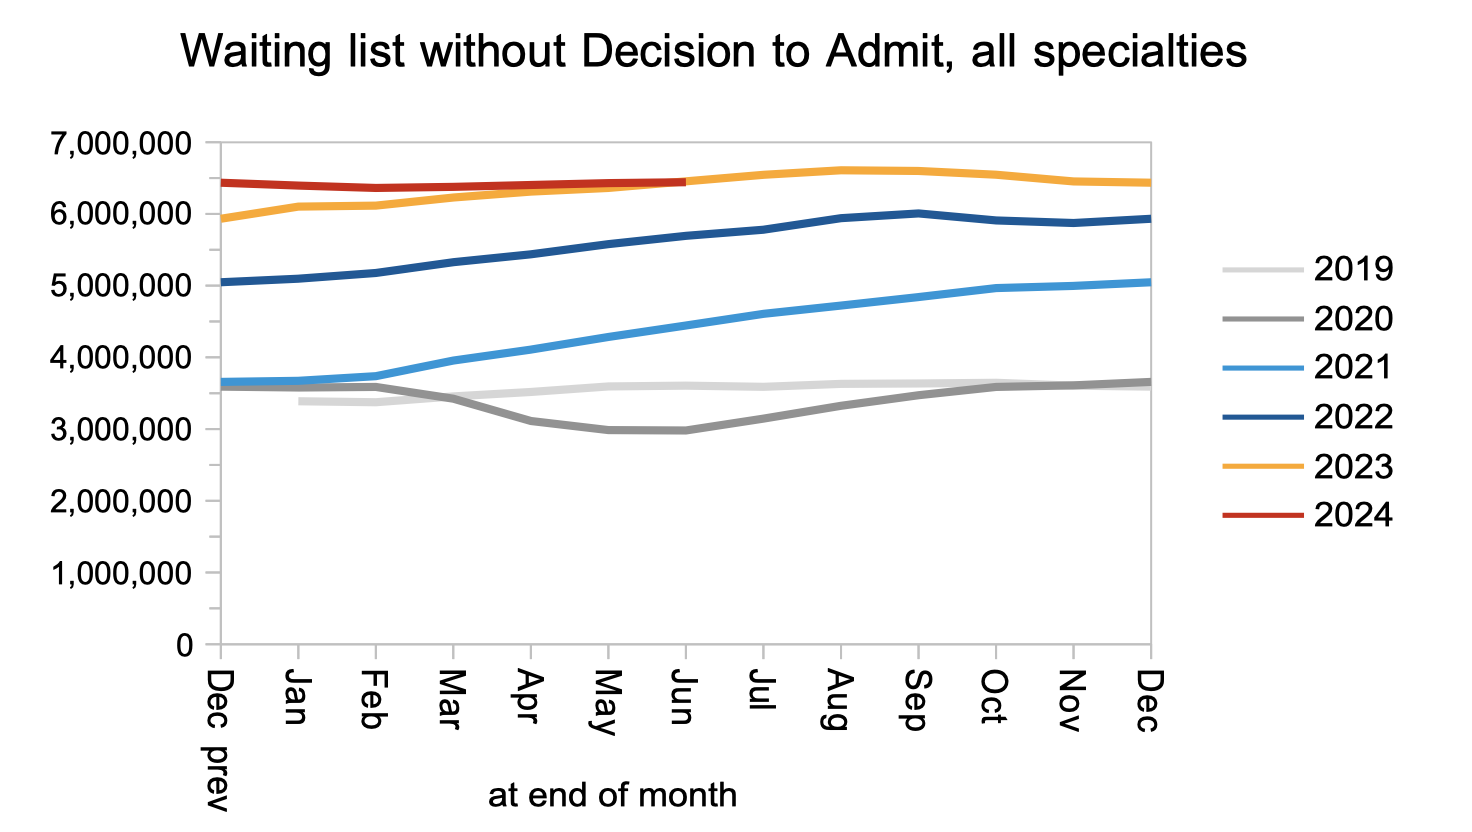
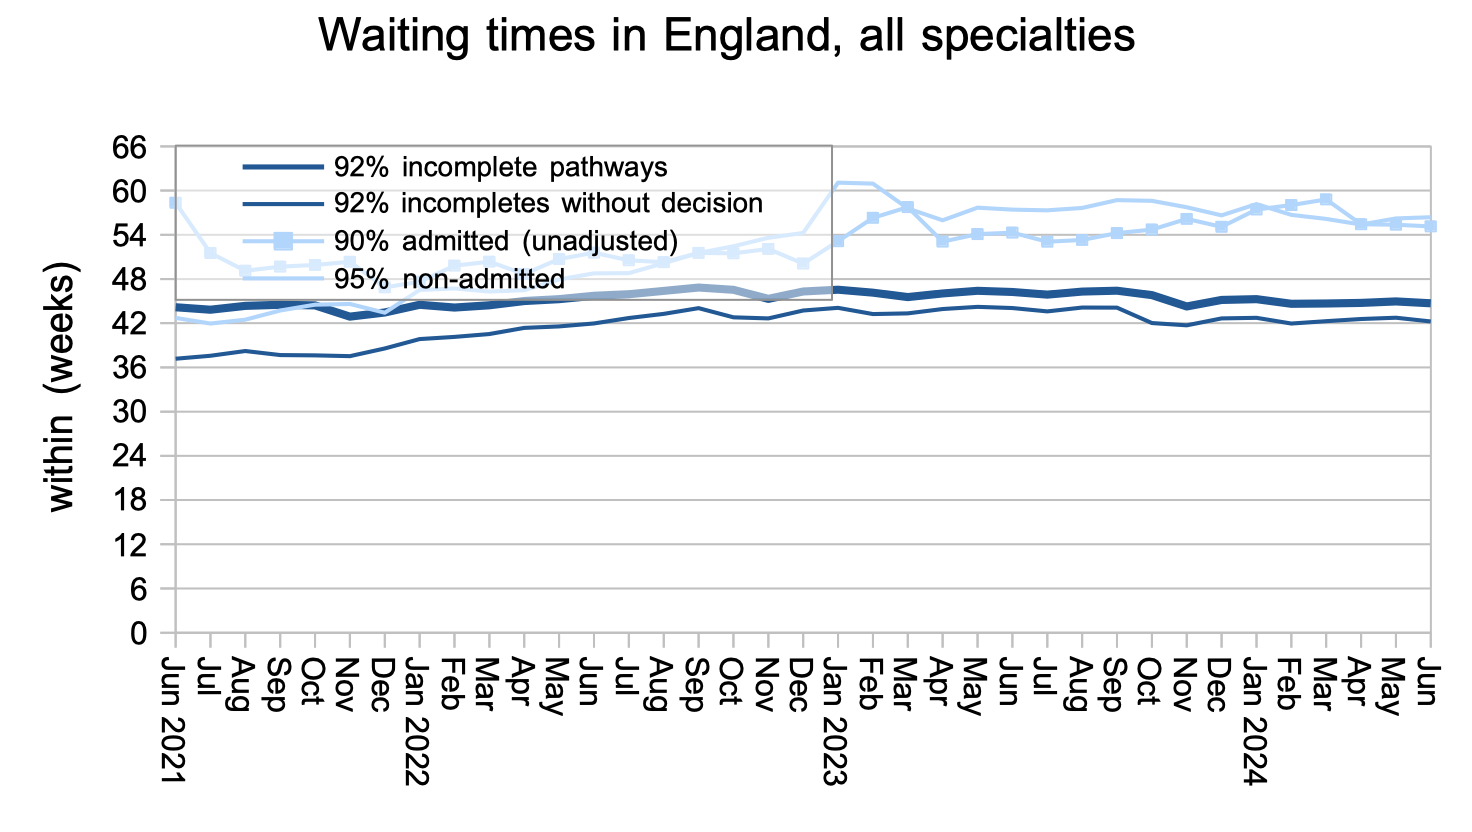
The net result of those clock starts, discharges, and other patients who continue their pathway towards admission, is that the waiting list of patients without a ‘decision to admit’ grew only slightly. Within those 6.4 million patient pathways are an estimated 27,888 whose eventual diagnosis will unexpectedly be cancer. Because their cancer is not yet suspected, they are not protected by the cancer waiting time targets, so they will wait as long as everyone else for a diagnosis and decision: typically 42.2 weeks.
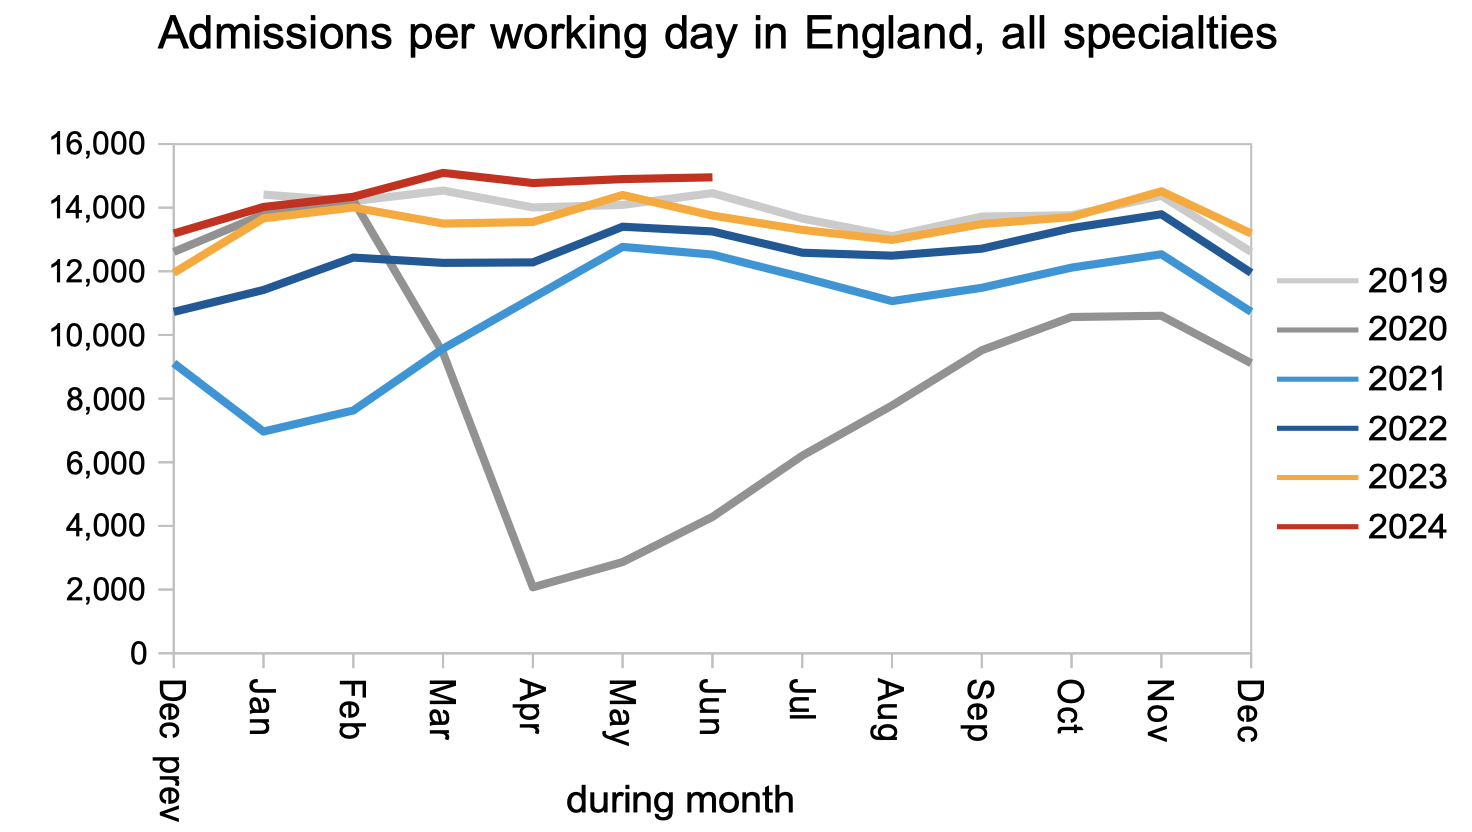
Patients were admitted for inpatient and daycase treatment at above pre-pandemic rates.
The net result of all that demand and activity, and other patients being removed from the list administratively, was that the reported waiting list grew only very slightly in June. To restore the statutory 18 week waiting time standard, the waiting list would need to roughly halve in size.
However the reported waiting list is likely to be a significant underestimate. The RTT rules state (in Chapter 5) that overdue follow-up outpatients (and other overdue ‘planned’ patients) should start RTT waiting time ‘clocks’, but this rule is not widely followed and has not been enforced in recent years. I am aware of some trusts who estimate that, following the pandemic, they have more overdue follow-ups than their entire reported RTT waiting list (and some have been good enough to publish those estimates in their board papers). It is a clinical risk to keep these time-limited patients waiting excessively, and the purpose of waiting time targets and rules is to protect patients from such risks, so let’s get them tracked and reported correctly so that they can be managed safely.
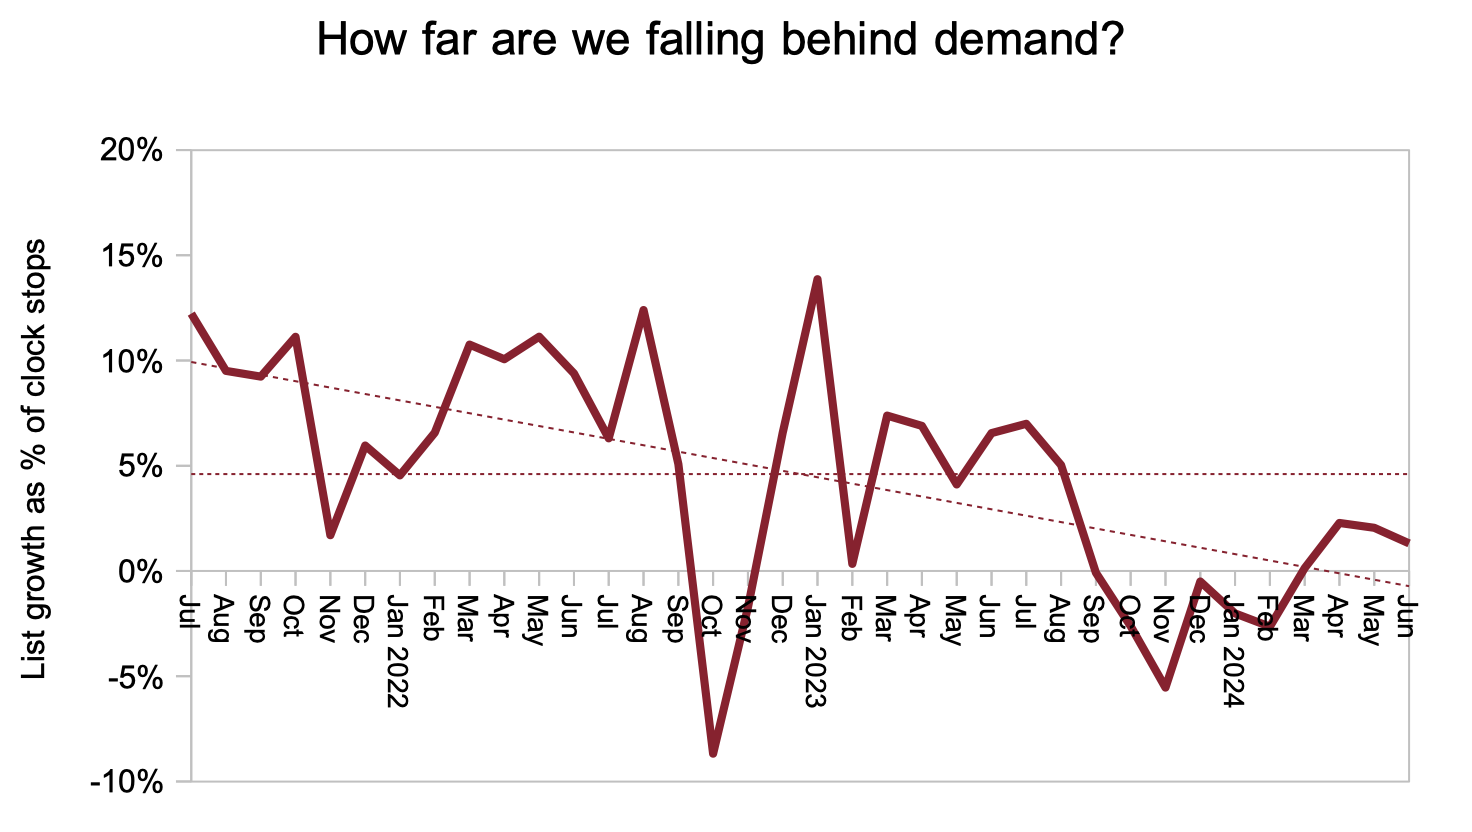
The next chart is new. It shows how far the English NHS is falling behind demand, and the answer is ‘only a little’. If activity were to increase by only a few percent, or if pathways could be streamlined to reduce effective demand by a few percent, then the waiting list would be shrinking rather than growing and waiting time problems would be melting away. Figures over the longer term show that, from 2011 to the pandemic in 2020, the NHS was falling only 1.5 per cent behind elective demand on average – an absolutely tiny number that accumulated into a significant problem. During the pandemic, of course, that gap ballooned.
Waiting times have been steady (and very long) since the height of the pandemic.
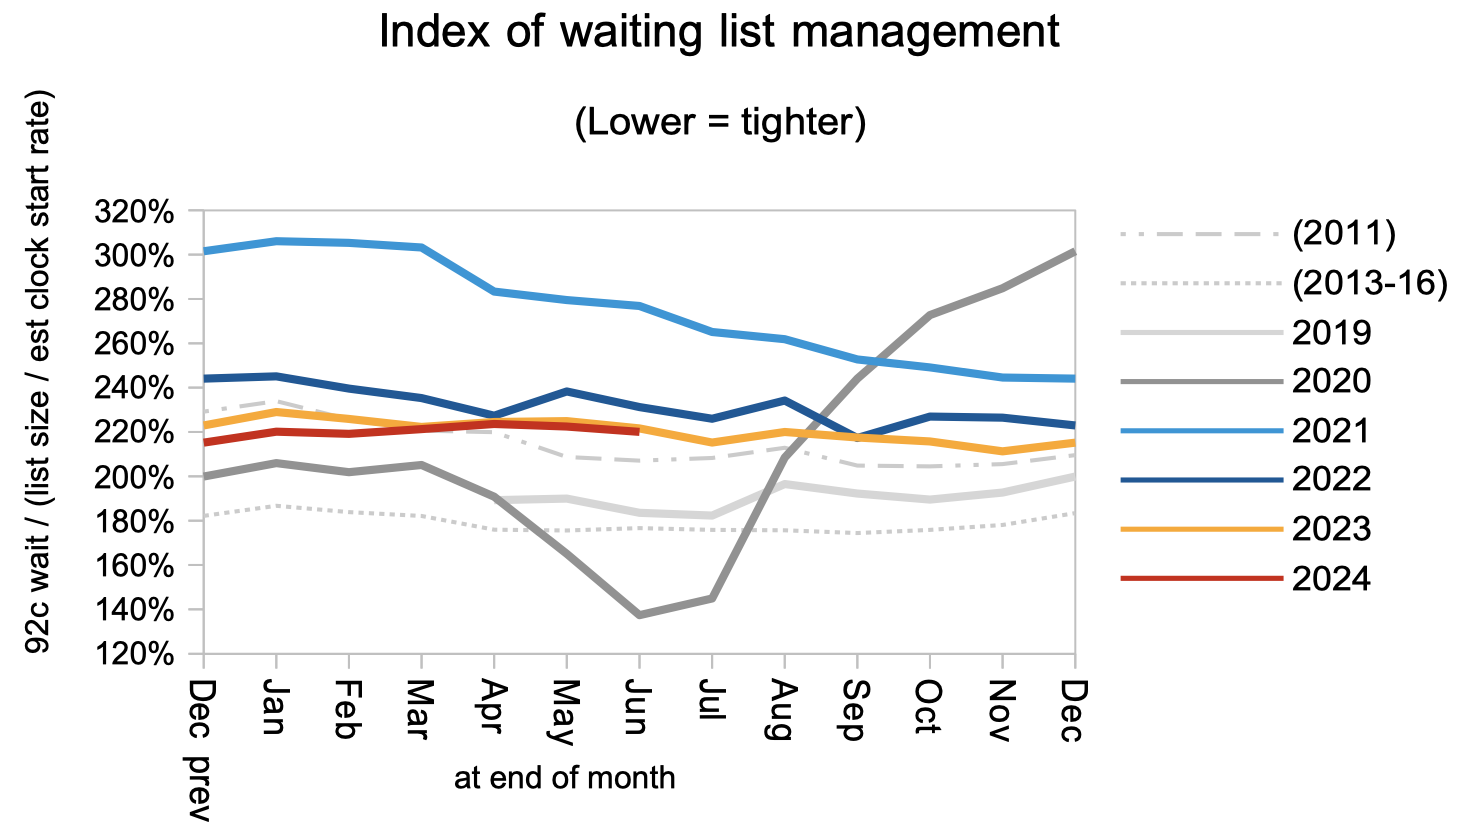
Waiting times are a function of both the size and shape of the waiting list, and the index below captures the shape at national level. I have added a new line to this chart, to show how good the shape was between 2013 and 2016 – that is the fine dotted line towards the bottom. At the moment the shape is worse than in 2011, which was before the sharp improvement in 2012 when the ’92 per cent within 18 weeks’ statutory target was introduced. The 18 week zone indicated in the ‘Waiting list in England’ chart above shows the range of waiting times that could achieve 18 week waits, depending on whether the shape returns to 2013-16 levels, or remains as poor as now, or falls somewhere in between.
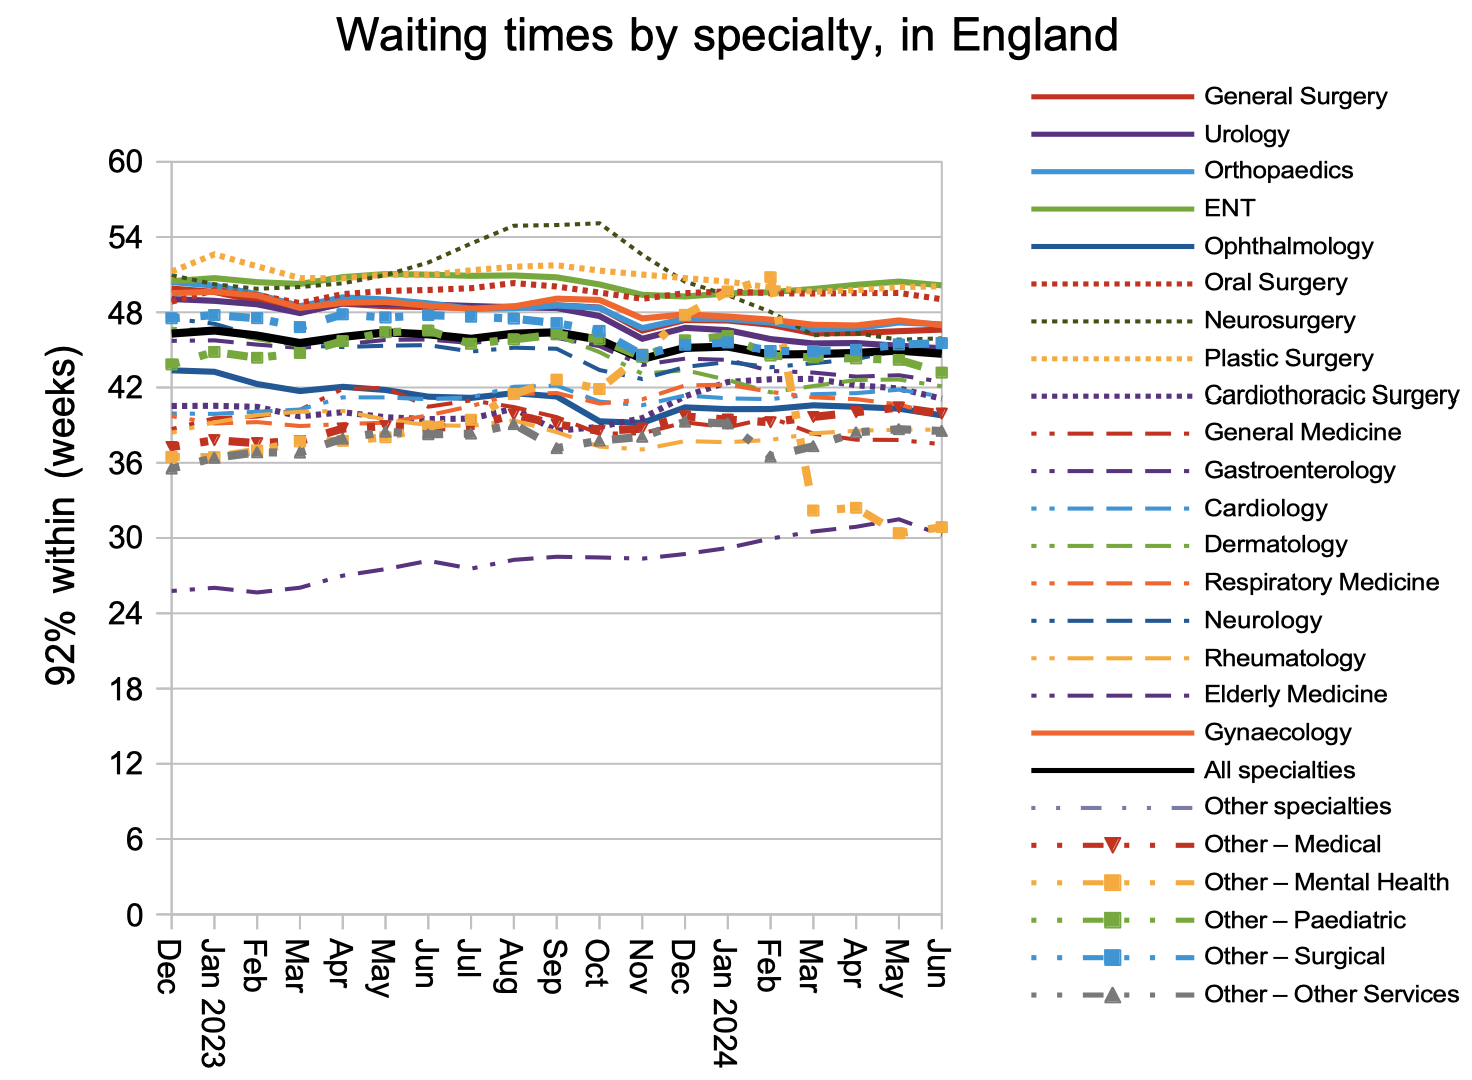
ENT remains the longest-waiting specialty at national level, beating plastic surgery by a hair. (Ignore the mental health waiting times which are severely affected by non-reporting trusts.)
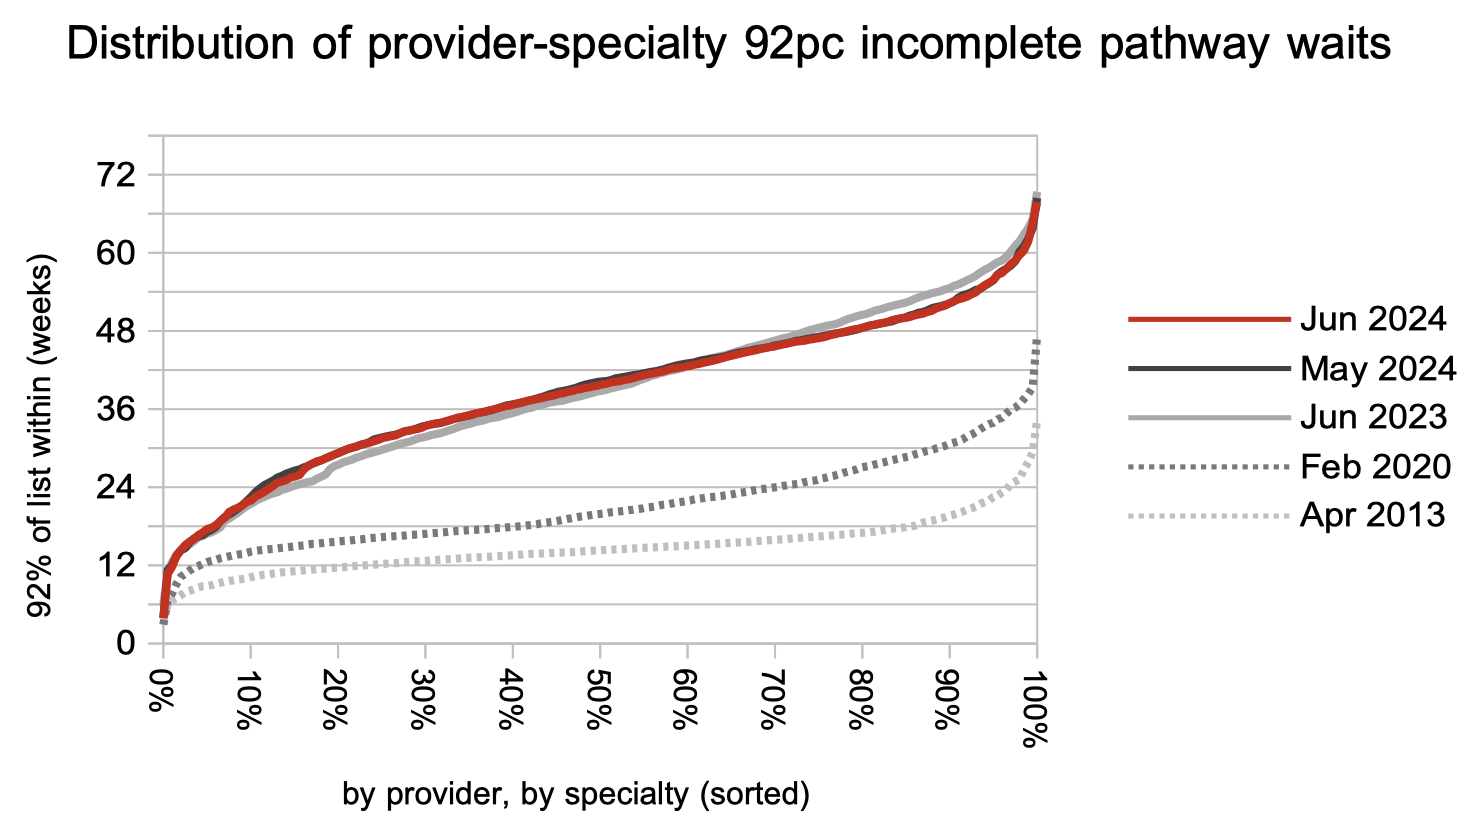
The final chart shows the distribution of waiting times across the country. The sharp-eyed among you might notice that it looks slightly different. That is because I am now omitting independent sector providers to reduce the time it takes to process all the data. The overall picture remains the same: waiting times are much longer than before the pandemic and, although the longest waits have been coming down, the experience for most patients has not improved over the past year.
Referral-to-treatment data up to the end of July, the first for this Labour government, is due out at 9:30am on Thursday 12th September.