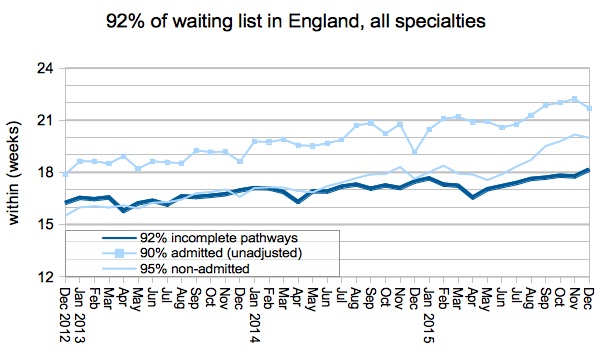
The English NHS has officially breached the national “18 weeks” target, according to new figures for the end of December 2015. This follows two months when the target was probably breached unofficially if you add non-reporting Trusts back in.
The 18 weeks target covers so-called “incomplete pathways”, and requires at least 92 per cent of patients on the waiting list to be waiting less than 18 weeks since referral to a consultant led service.
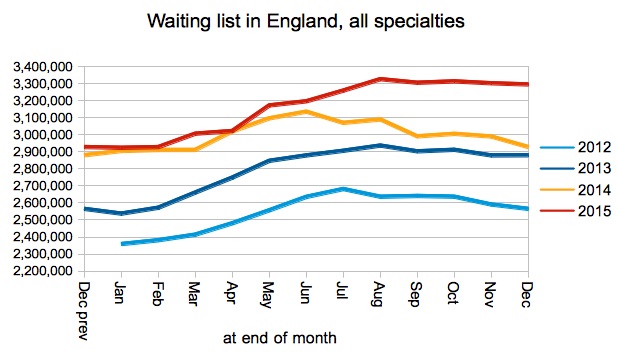
This national-level breach in the official figures has long been expected. Since 2012 the English waiting list has been growing rapidly by around 1,100 patients per working day, as the NHS fails to keep up with demand for elective treatment.
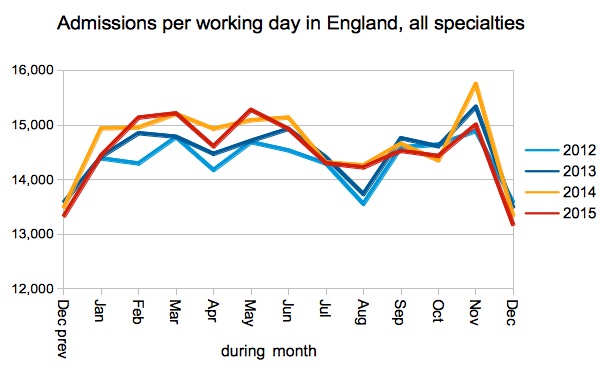
In December a couple of other things happened as well, which won’t have helped but were not the underlying cause of the breach. NHS England’s National Winter Resilience Room instructed providers to free up capacity in advance of Christmas, which led hospitals to cancel elective operations in bulk. And a junior doctor’s strike was cancelled at the last minute, but not before thousands of elective operations had been cancelled. Between them, these events brought the breach of the target forwards by a few days, but did not alter its inevitability.
In the following analysis, all figures come from NHS England. If you have a national statistic that you’d like to check up on, you can download our Gooroo NHS waiting times fact checker.
England-wide picture
The official waiting list finally breached 18 weeks, after creeping up on it for the last three years. The main cause is the growing waiting list, but the breach was also helped along by a seasonal deterioration in patient scheduling.
Anything that disrupts patient scheduling, and causes long-waiters to remain on the waiting list instead of being treated, is going to push up waiting times. Christmas and winter bed crises are generally disruptive, and the seasonal downturn in the treatment of long-waiting patients can be seen as a dip in the admitted patient performance in the chart below (the top pale blue line). The extra cancellation of elective operations to free up beds over Christmas probably contributed too.
It is also worth noting the poor performance of NHS England’s central commissioning function, which achieves only 90.8 per cent of its waiting list within 18 weeks (or 92 per cent within 19.0 weeks). If it were a region, it would have the worst waits in England.
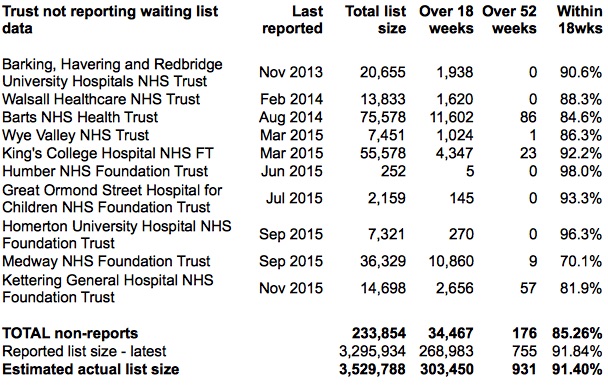
If you add the last known positions of non-reporting Trusts back into the data, performance against the 92 per cent target falls from 91.8 per cent to 91.4 per cent. It is on this basis that the target has been breached unofficially since the end of October 2015.
Returning to the officially-reported figures (i.e. without adding non-reporting Trusts back in) the waiting list remained roughly steady, instead of shrinking as it usually does during December. The underlying year-on-year growth in the waiting list is the main reason for the growing waiting times.
Fewer patients were admitted per working day than in any of the previous few Decembers. If the NHS does not start keeping up with demand, then waiting lists and waiting times will continue to grow.
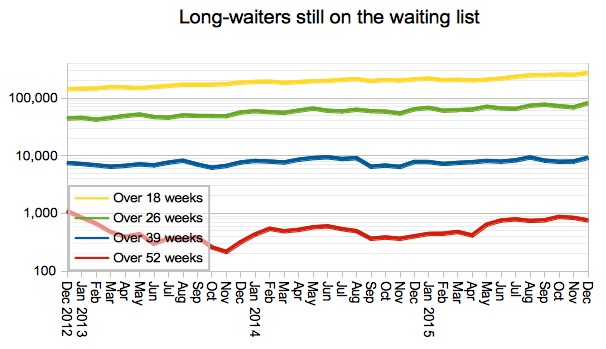
The number of extreme long-waiters on the waiting list is roughly steady in the official figures, but this is unlikely to represent the true picture because there are probably plenty of one-year waiters at non-reporting Trusts.
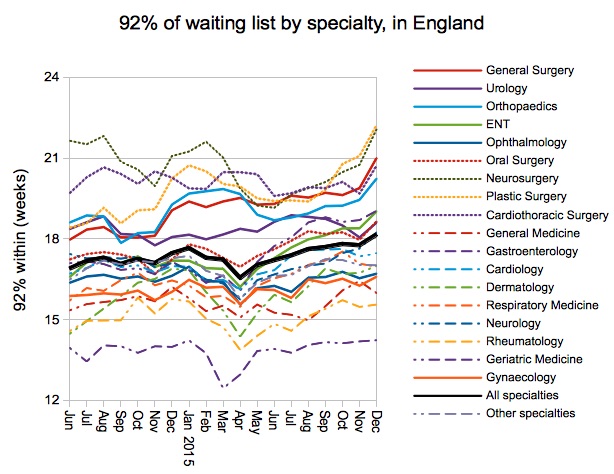
All surgical specialties except ophthalmology and gynaecology were already breaching 18 weeks, and deteriorated sharply again in December. In an uncharacteristic lapse, the Royal College of Surgeons announced this as “Every single surgical specialty missed the target in this month”… the two exceptions of course being specialties which fall under different Royal Colleges. (The RCS have since corrected their website.)
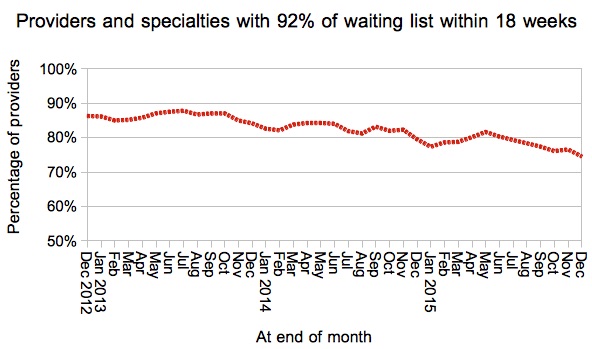
If we dive down to the 2,400-odd local hospital services (specialties within providers) the gloomy picture continues. Just under 75 per cent of local services are now achieving the 18 week target, which is the worst since February 2012 when this target was in the process of being achieved for the first time.
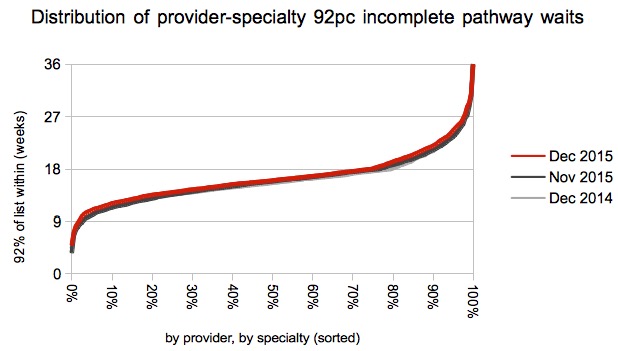
The deterioration in performance was concentrated among local services with the longest and shortest waiting times, with less change in the middle.
Local detail
We’ve done some interactive maps showing the waiting times position by specialty for every Trust and CCG with significant numbers of admissions. If you want to look your own Trust up quickly, then visit our 18-weeks reports page.
Last month’s table of long-waiting providers was topped by Kettering General Hospital NHS Foundation Trust, who have since stopped reporting and so have vanished from the table. That leaves the top slot free for Brighton and Sussex University Hospitals NHS Trust, whose 92nd centile waits slipped during December from 27.4 weeks to 29.9 weeks.
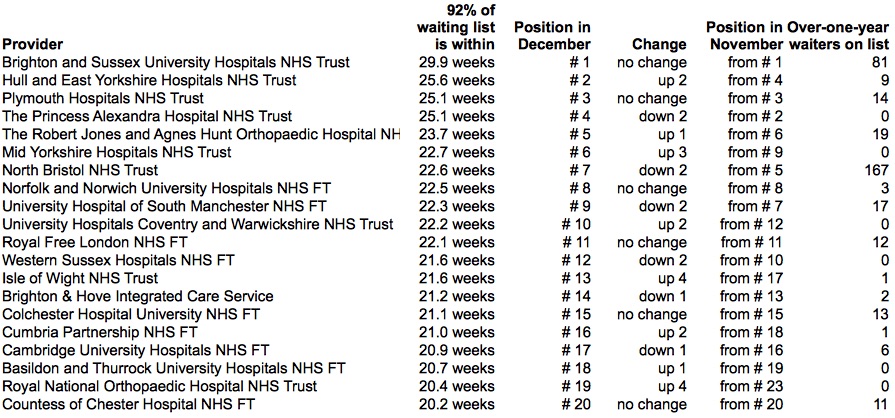
Only one Trust dropped out of the table, but 92 per cent of their patients were still waiting up to 20 weeks so not much to cheer about there either.
Data for January is due out at 9:30am on 10 March 2016. NHS England helpfully told me on Twitter that “All publications that are part of the combined performance summary will continue to be published on 2nd Thurs of the month”, and this includes 18-week waits.
