

The planning guidance for 2018-19 is now being followed-up with further details, and the good news is that you can build these into your Gooroo Planner models quite easily. This blog post explains how to do it.
The key table in the supplementary guidance letter contains the following “National 18/19 ambition” about minimum levels of growth:
GP referrals: 0.8%
Other referrals: 4.6%
1st outpatient appointments: 6.4%
Follow-up outpatient appointments: 4.1%
Elective day cases: 4.2%
Elective ordinary cases: 0.3%
A&E attendances: 1.1%
Non-elective 0 LoS: 5.6%
Non-elective 1+ LoS: 0.9%
These are to be taken together with the central planning assumption in the main guidance:
3.7: … commissioners and providers should plan on the basis that their RTT waiting list, measured as the number of patients on an incomplete pathway, will be no higher in March 2019 than in March 2018 and, where possible, they should aim for it to be reduced.
So let’s go through the numbers line by line, and look at how to implement them in Gooroo Planner. I will assume that you have already loaded all specialties into Gooroo Planner in the usual way, and therefore have a single model at specialty or sub-specialty level, covering all the various points of delivery.
If you are highly proficient with Gooroo Planner then the summary below will probably be enough for you. If you are a regular user then the step-by-step instructions might be more suitable. And if you can’t easily relate to all this then don’t worry – we’re here to support you and will be happy to help.
Summary
You can apply the growth figures for referrals to outpatients, and for non-electives, simply by adding those four numbers to your high-level Growth assumptions. Gooroo Planner can then apply them across the board.
To stop waiting lists from growing, just select the “Match new demand” activity scenario.
Then use the report controls to subtotal everything by activity type, and Gooroo will show you the overall increases in outpatient and elective activity, for direct comparison against the national minimum growths.
If your activity growth isn’t high enough, then you can add more. Convert your model into a specified-activity report, and increase activity in long-waiting specialties until the requirements are met.
That’s the summary, and now for the step-by-step detail.
Referrals
You can easily apply the referral growth assumptions to all specialties in one go.
For example, you might update your dataset with the following CSV file (adapted to the names you have used for new and follow-up outpatients in your model):
HeadType,Growth
New outpatient,0.008
Follow-up outpatient,0.046
…which will automatically apply these growth assumptions across the board.
But you probably already have a high-level statistical assumptions table, and can simply add a column for Growth to the end of this (or edit any Growth assumptions that are already there).
If you are modelling A&E attendances in Gooroo Planner (most people don’t) then you should also include Growth of 0.011 for them.
Electives
The figures for outpatient and elective growth all refer to activity, and I interpret the guidance as requiring those minimum growth assumptions in aggregate (as opposed to specialty-by-specialty). So the first step is to check whether your model already complies with these growth assumptions, and then if it doesn’t the second step is to add further activity. You can do it like this:
- Create a report with the future activity scenario “Match new demand” selected, and the system report style “PastAndFutureWithRecurringDemand” – this will satisfy the requirement in the main guidance that waiting lists should not grow.
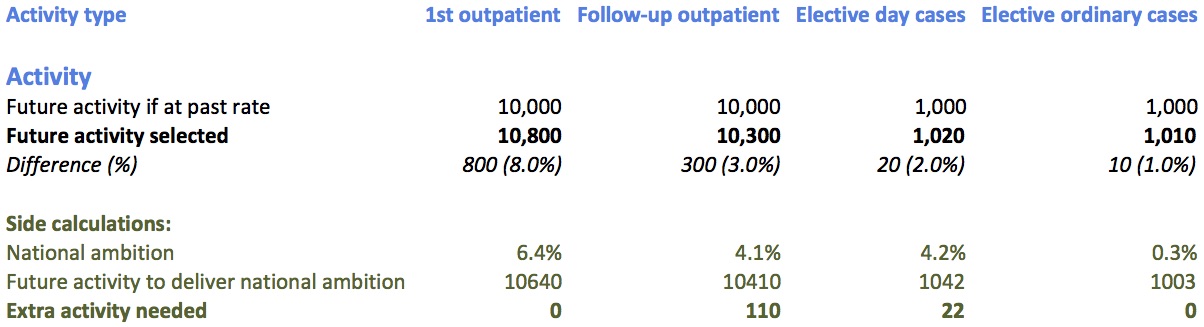
- View the report, and in the “Header Grouping” control (top left), untick everything except HeadType. The third row of numbers (see figure below) will show the percentage growth in activity, aggregated across each type of elective activity – if this exceeds the minimum national “ambition” then everything is fine and you are finished with this section…
- …but if it doesn’t then you’ll need to work out how much extra activity you need using a side calculation like the one illustrated below this section, and then do the following:
- From the Reports manager, use “Convert to dataset” with “Convert to a specified-activity scenario” selected – this will create a dataset that is based on keeping the list sizes constant, but which allows you to increase activity in the services of your choice.
- Download that dataset and open it in a spreadsheet. You can delete every column except 1) the header columns (with field names beginning “Head…”), and 2) the column called “FutActiv” which contains your future activity scenerio.
- Go through the FutActiv figures, increasing some of them (e.g. those with the longest waiting times) until you have added enough activity to meet the national ambitions overall.
- Save this edited table as a CSV file, and use it to update the dataset you just created.
- Then create a new report, retaining the future activity scenario “Use data provided (FutActiv)” which has been automatically pre-selected for you.
Non-electives
The guidance splits non-electives into 0-day and 1+day, and this unfortunately means that you will need to do the same. Fortunately this is easily done in your patient-level inpatient activity file (using a spreadsheet if necessary) by assigning 0-day patients to a different activity type (e.g. if activity type is non-elective, and BedLOS = 0, then HeadType = NonElec0d).
Demand and activity are the same thing for non-electives, so you can then apply the national minimum ambitions very simply by using the Growth figures as before. For instance:
HeadType,Growth
NonElec0d,0.056
NonElecIP,0.009
We’re here to help
If you are advanced at using Gooroo Planner then all this will look easy to you. But if you aren’t then don’t worry because we will be delighted to support you as you bring this year’s planning round to a successful conclusion.