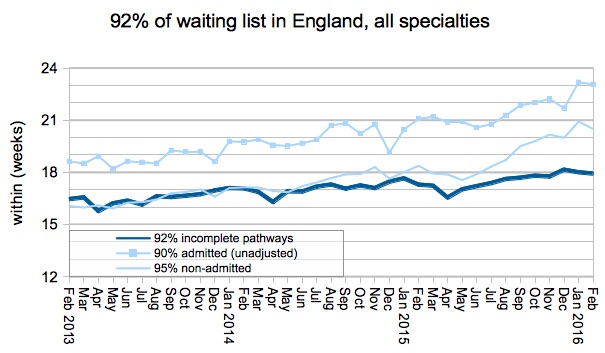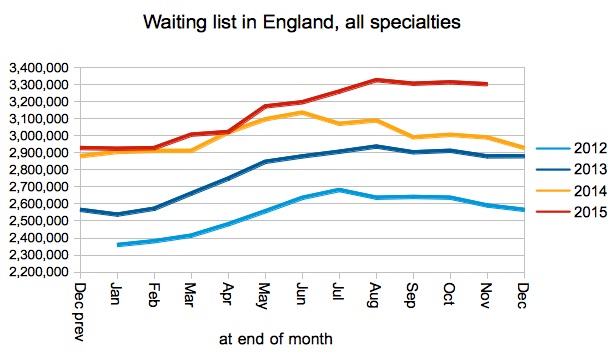
England’s referral-to-treatment (RTT) waiting times improved from 23.0 to 22.4 weeks in June, not because the NHS suddenly started keeping up with demand (in fact the waiting list size broke new records), but because admission rates perked up and the shape of the waiting list tightened.
However there was bad news at the ultra long waiting end of the waiting list, because the number of one year waiters grew for the first time in 12 months.
For analysis of waiting times performance at a particular organisation, visit our reports page. You can also access maps of the latest waiting times across England for A&E, cancer, and RTT.
In the following discussion, all figures come from NHS England and NHS Improvement. If you have a national statistic that you’d like to check up on, you can download our RTT waiting times fact checker
England-wide picture
Headline waiting times improved by 4 days nationally, down from the end of May peak.
The list of non-reporting trusts did not change in June. If their last known positions are added back in, then the waiting list topped 4.5 million patients for the first time since records began.
Returning to the reported numbers, the waiting list size ticked up to a new record, and three years of waiting list growth would need to be reversed before 18 weeks became achievable again.
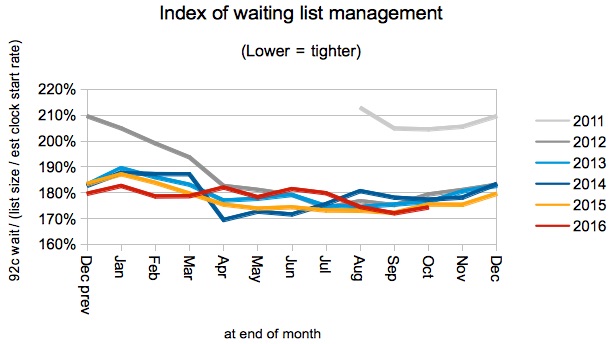
The index of waiting list management, which bundles up the influences on waiting times other than list size, improved sharply in June and moved closer to the levels seen between 2012 and mid 2017. This is a good thing, but improvements in the waiting list shape can only be banked once, meaning that further significant gains on this measure are less likely.
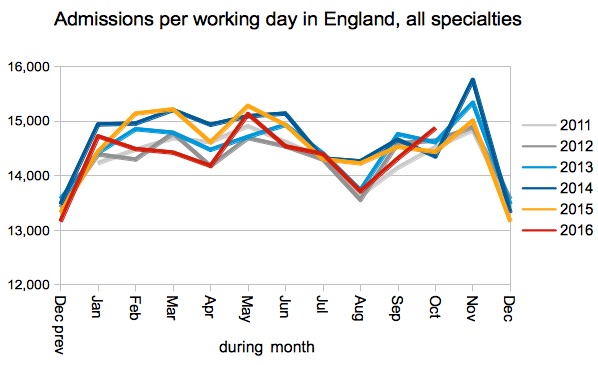
The admission rate improved to the highest June value since 2016. In the long run, keeping up with demand and shrinking the waiting list is the only way to achieve sustained improvements in waiting times, and this is particularly important at the longer-waiting, heavier end of the casemix where patients need to be admitted for treatment.
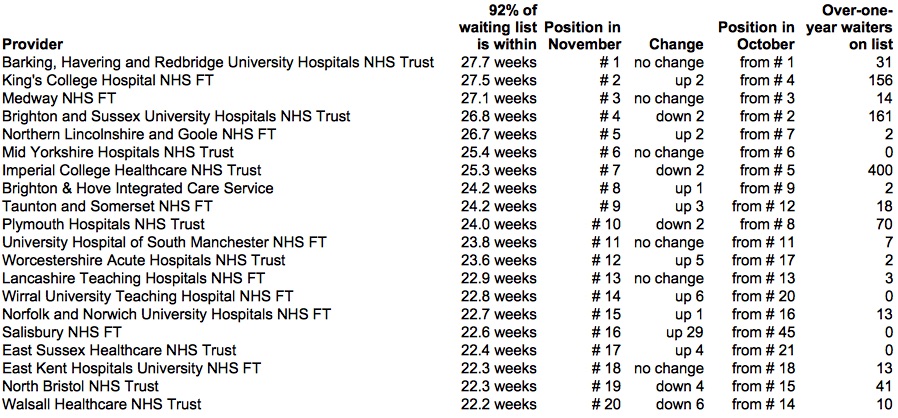
After a year of improvements, the number of one year waiters started to edge up again. These ultra long waiters are concentrated at just six trusts, with the largest number waiting at King’s College Hospital NHS Foundation Trust.
Across England, two-thirds of one year waiters are found in just three specialties: Orthopaedics (29 per cent), and “Other” plus General Surgery (37 per cent) – I have lumped the last two together because much of Other is subspecialties separating out of General Surgery.
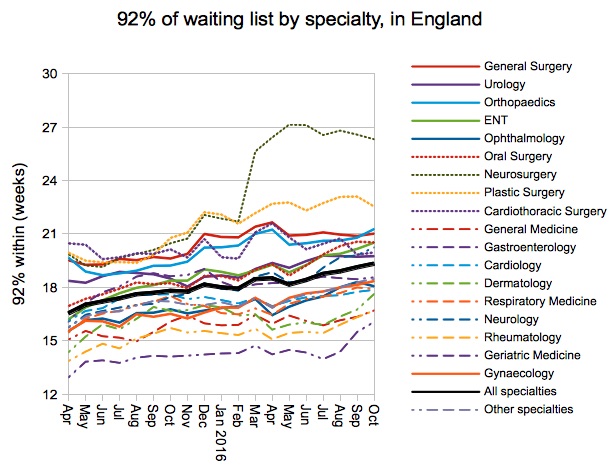
The longer surgical waits (which rely more on admissions) generally improved in June, while the shorter medical waits generally became longer. Only Geriatric Medicine is achieving 18 weeks at national level.
Local detail
The proportion of local services (specialties within trusts) that are achieving 18 weeks edged down to just 50.1 per cent. We are very close to the point where achieving 18 weeks is a minority sport.
The distribution of waiting times converged slightly on 18 weeks, in line with the specialty picture above, as moderate waiting times increased and some of the longer ones improved.
Waiting times at University College London Hospitals NHS Foundation Trust have increased from 25.3 to 27.4 weeks during June, propelling the trust some 22 places up the table of longest-waiting providers and earning it a place in the top twenty. Their waiting list has grown sharply, and they comment in their July board papers that “This growth is partly due to data quality issues, reduced clinical activity in early April and reduced validation effort in April and May following the Epic launch.”
 Referral-to-treatment data for July is due out at 9:30am on Thursday 12th September.

