

The current English NHS Standard Contract 2014/15 sets penalties for Trusts who breach the 18-week referral to treatment (RTT) waiting times targets. If a service breaches a target by more than the allowed tolerance, it can be fined £400 every time it admits a long-waiting patient, £100 every time it treats a long-waiter in outpatients, and £100 for every long-waiter remaining on its waiting list at the end of each month.
I have noted before that it is perverse to punish hospitals for treating their long-waiting patients, when treating them is precisely what they should do. Here I want to examine something else: how the perverse penalties have a much bigger impact than you might expect.
Let’s look at the £400 admitted patients penalty. Obviously, £400 for admitting a long-waiter is four times bigger than the £100 penalty for leaving them on the waiting list, so at first sight it looks tougher. On the other hand, wouldn’t it be worth biting the bullet and taking the £400 hit now? Otherwise you’ll end up paying £100 every month while they remain on the waiting list, and you’ll still have to pay the £400 when you eventually admit them.
Except that this arithmetic misses something important: the tolerances on the targets. These tolerances, coupled with the way waiting times dynamics work, mean the £400 penalties are far scarier than they first appear.
To understand why, let’s take a look at a waiting list that is steadily growing. At the start, the waiting list is nice and small and looks like the figure below.
In these figures each blob is a patient, and patients are sorted by referral date so that the longest-waiters are on the left. Every week, new patients are referred and they arrive on the right hand side of the waiting list. And every week, patients are admitted. Because this is a well managed waiting list, we first make sure that any urgent patients (the red rectangles) are booked in quickly, and then we book the routine patients (the ovals) starting where possible with the longest-waiters. (All figures were created using Gooroo SimView; you can learn more here and play with it here.)
The figure below shows that we are about to admit a couple of urgent patients, lots of 12- and 13-week waiters, and one patient who was previously cancelled and has ended up waiting 15 weeks. Because the list is small, the entire waiting list is within 18 weeks and all the patients we admit are within 18 weeks as well.
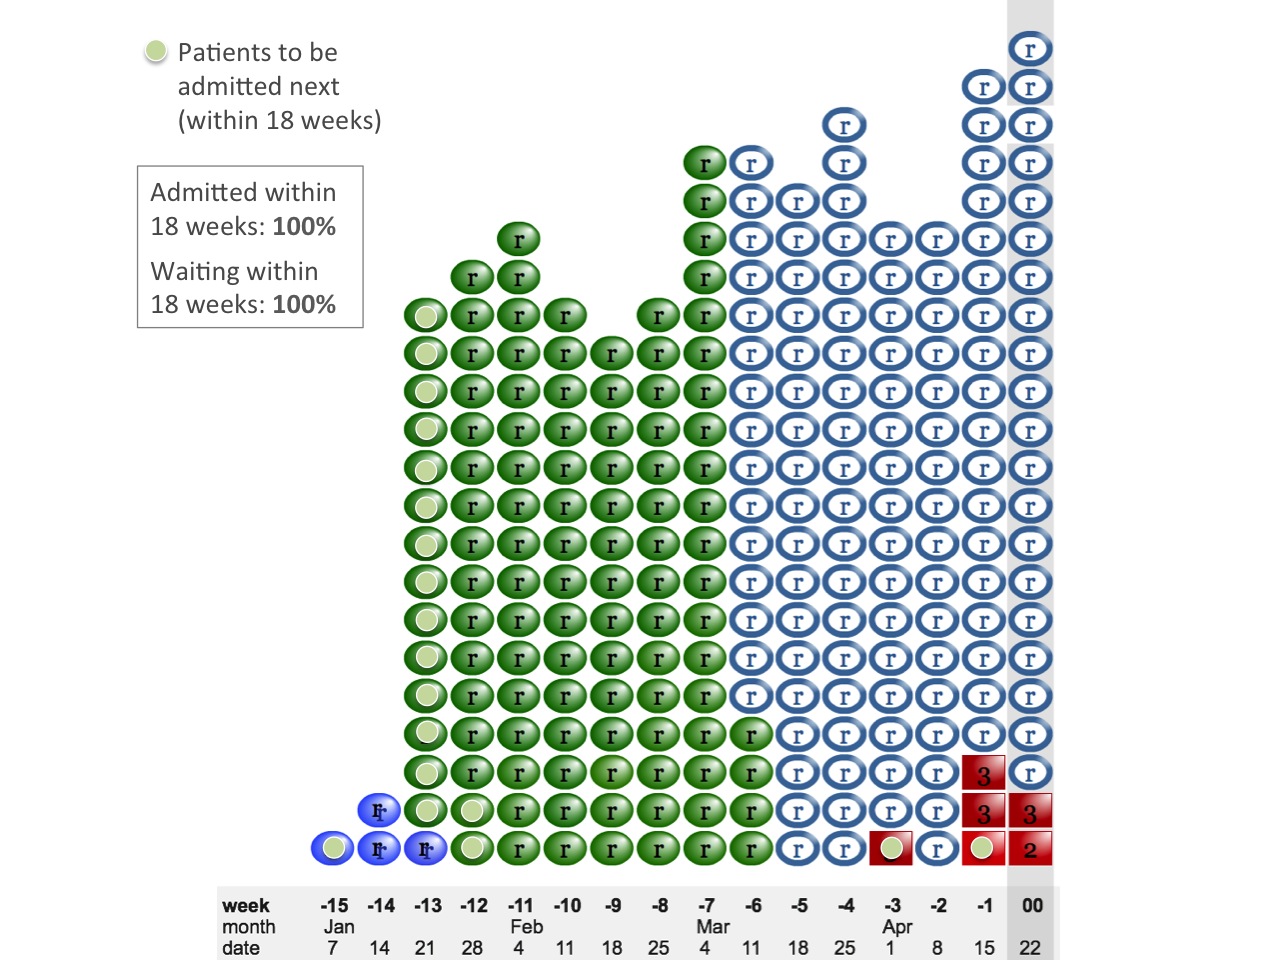
Small waiting list
As the waiting list grows, our waiting times go up. In the next figure, the longest-waiting patients are pushing close to 18 weeks. We are still in the happy position where very few patients ever wait longer than 18 weeks, so we are not breaching any targets yet. Nearly all the patients we admit have waited less than 18 weeks (the one exception was previously cancelled by the hospital), and nearly all the patients still on the waiting list are under 18 weeks too.
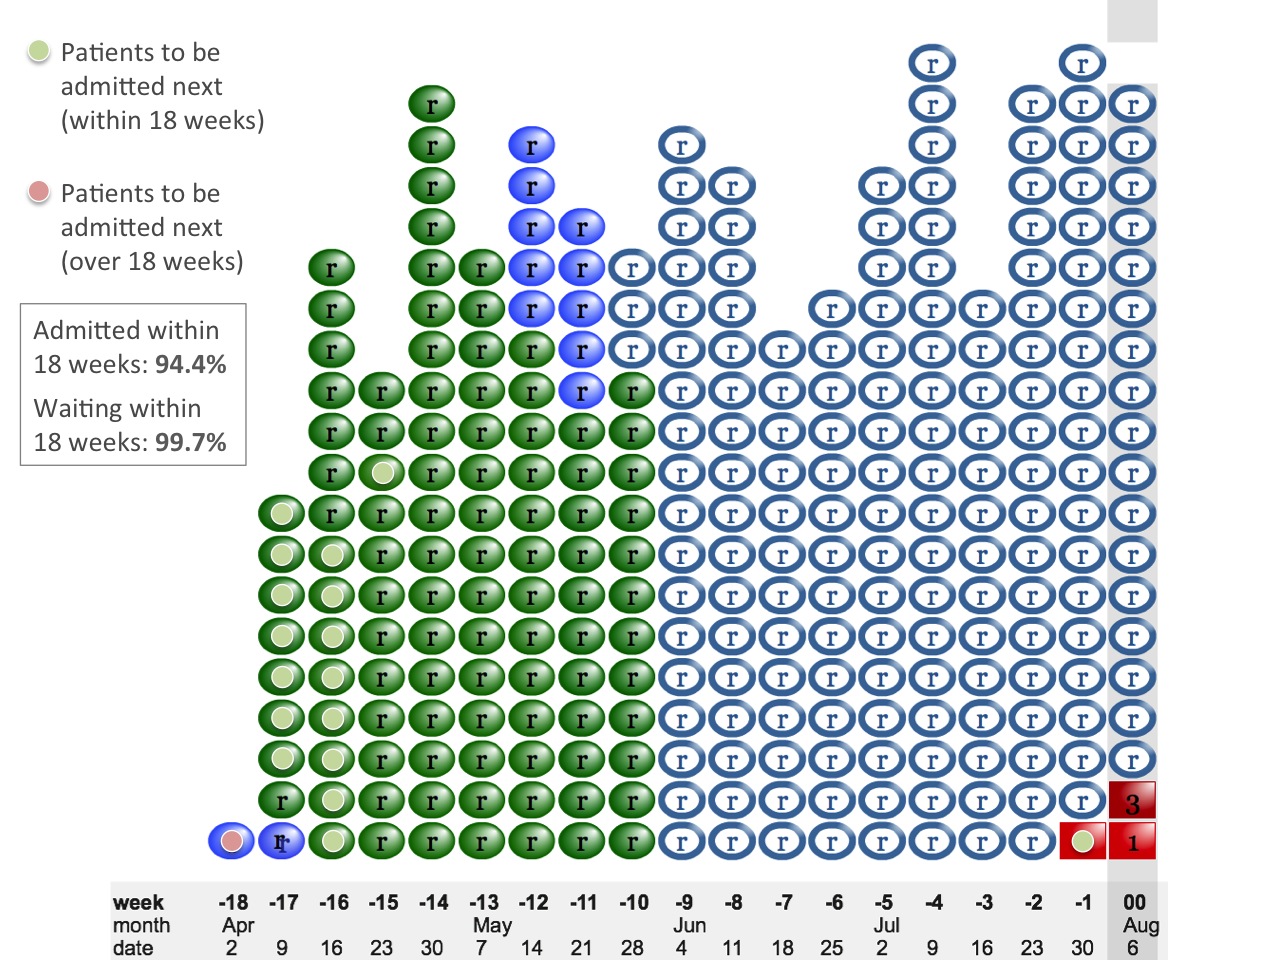
Just below breach
Then the list grows just a little more, and suddenly everything changes.
Now the snout of the waiting list has grown past 18 weeks. Suddenly, nearly all the patients we admit are long-waiters and we are hitting a wall of £400 penalties. The target is that 90 per cent of admitted patients should have waited less than 18 weeks, and our performance this week will be a dismal 21 per cent.
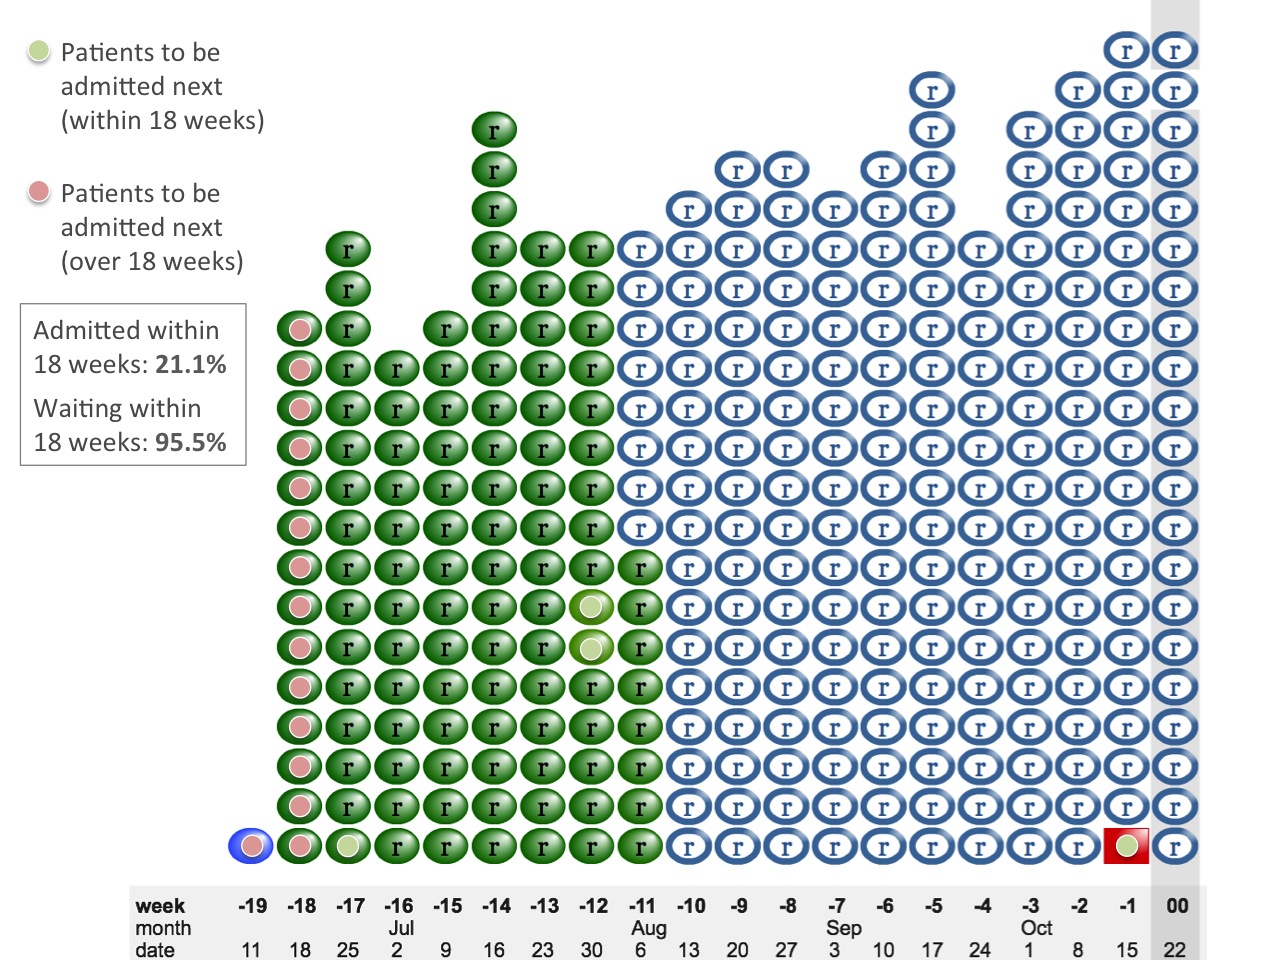
Just above breach
Despite this carnage on the admitted patient target, we aren’t triggering any £100 incomplete pathways penalties at all. Some 95.5 per cent of the waiting list remains below 18 weeks, comfortably achieving the target of 92 per cent. So perhaps (the devil on our shoulder whispers) we could do something about those £400 penalties by limiting the number of long-waiters we admit, and still stay within tolerance on the incomplete pathways target.
This is how the admitted patients target has such a disproportionate and perverse effect. It kicks in first, and it kicks in hard. And it holds out the tantalising possibility that perhaps, with just a little bit of perverse waiting list management now, we might avoid those £400 penalties altogether and hardly pay any £100 incomplete pathways penalties either. So it is unsurprising that these £400 penalties deter so many services from doing the right thing and treating all their longest-waiting patients.
This example also shows why the percentage admitted within 18 weeks is such a poor measure: in a well managed list, performance flips abruptly from triumph to disaster without warning. So it is much better to monitor the waiting time within which 90 per cent of patients are admitted, because that measure changes gradually and you can see the problem approaching. In other words, don’t monitor X per cent admitted within 18 weeks; monitor 90 per cent admitted within X weeks instead.
Now, you might complain that the waiting list in this example should not have been growing in the first place. You would be right. A waiting list that grows too large is a sign of planning failure by the hospital, or the commissioner, or both. If waiting lists are kept small enough, then good patient scheduling will achieve all the 18 weeks targets comfortably.
But the purpose of targets and penalties is to change human behaviour, so it is germane to consider how they affect managers when a waiting list is growing into trouble. At the moment, they encourage perverse waiting list management: limiting the number of long-waiters being admitted so as to avoid hitting a wall of penalties.
That is why it would be better if the admitted and non-admitted targets were abolished (or at least only applied to unauthorised breaches), leaving the incomplete pathways target to do a better job of ensuring that patients are treated within 18 weeks, and do not become stranded the wrong side of 18 weeks if they tip over into breach.