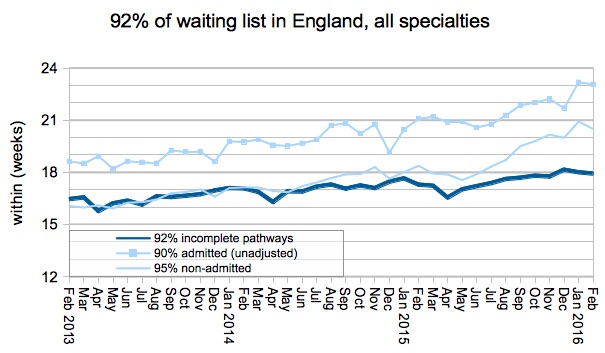
The English NHS achieved in May what it usually does in April – a slight improvement in elective waiting times. This was fuelled by two things: a higher rate of activity, and an increased focus on the longest waiting patients on the waiting list.
But it wasn’t enough to meet the 18 week target.
The reported number of one year waiters rose sharply, from 870 at the end of April to 1,003 at the end of May. This is the first time that reported one year waiters has exceeded 1,000 since December 2012, and is nearly five times the minimum (214 one year waiters) that was achieved in November 2013.
In the following analysis, all figures come from NHS England. If you have a national statistic that you’d like to check up on, you can download our Gooroo NHS waiting times fact checker.
England-wide picture
Performance against the 18 week target improved slightly on the official figures, with 92 per cent of the waiting list having waited less than 18.2 weeks at the end of May (compared with 18.5 weeks in April).
There was a record-breaking focus on treating long-waiting patients, which achieved levels not seen since 2008. In a sign of increased efforts to achieve 18 weeks again, 95 per cent of non-admitted patients had waited up to 21.3 weeks (longest since May 2008), and 90 per cent of admitted patients had waited up to 24.4 weeks (longest since February 2008).
The list of non-reporting Trusts was unchanged from April. Adjusting for the last known position at non-reporting Trusts, 91.4 per cent of the waiting list was within 18 weeks, compared with the target of 92 per cent.
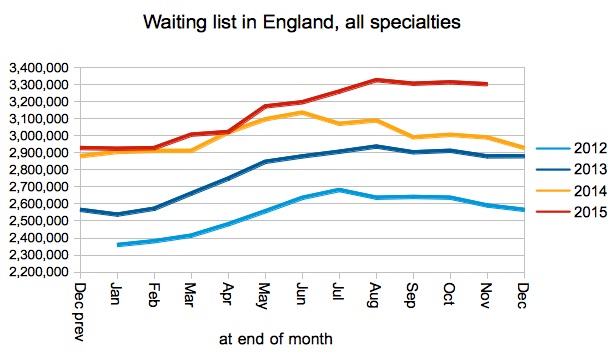
The waiting list grew in May, which is usual for the season, and remains much larger than it was last year.
Admissions per working day were sharply up, and comparable with recent years. It is possible that this might be an artefact of May only having 20 working days, and increased operating at weekends making the number of working days less significant. Nevertheless the higher activity rate is welcome, and will have helped improve performance on waiting times.
The number of over 18 week waiters fell slightly in May, but the reported number of one year waiters rose above the 1,000 mark for the first time since 2012.
Specialties with short waiting times got worse, and specialties with long waiting times (mostly) got better in May.
Overall, the proportion of local services (at Trust-specialty level) achieving 18 weeks improved slightly.
In line with the specialty-level figures above, May saw an improvement in long waiting times, and a deterioration in short waiting times, compared with April.
Local detail
We’ve done some interactive maps showing the waiting times position by specialty for every Trust and CCG with significant waiting lists. If you want to look your own Trust up quickly, then visit our 18-weeks reports page.
There was little movement in the top twenty longest-waiting Trusts, and waiting times got a little longer at both Brighton and Sussex University Hospitals NHS Trust and King’s College Hospital NHS Foundation Trust.
Data for June 2016 is due out at 9:30am on 11th August 2016.


