Back in October 2012, England was comfortably achieving its new 18 week target, with 92 per cent of the waiting list extending just beyond 16 weeks.
But then the waiting list started to grow, and waiting times started creeping up. A year later, waiting times had risen by about half a week. The following year, another 0.6 weeks. The year after that, about the same again. A pretty consistent picture. And that brings us up to October 2015.
October 2015 is special because that was the month when England started breaching the 18 week target again (if you factor in non-reporting trusts). And then waiting times really took off.
In the following 12 months, according to figures just released, England’s RTT waiting times rose by an eye-watering 1.5 weeks. That’s treble the previous rate of growth. And there is no end in sight.
Let’s turn to the detail. As usual, in the following analysis, all figures come from NHS England. If you have a national statistic that you’d like to check up on, you can download our elective waiting times fact checker.
England-wide picture
The 92 per cent incomplete pathways line is the one to watch, because it shows the state of the queue. This dark blue line shows how rapidly waiting times have grown over the last 12 months. The pale blue lines show how the NHS is responding to that queue by treating the longest-waiting patients.
All the charts in this report are based on the officially reported figures, however those figures are not complete because some trusts are not reporting data. If you add their last known positions back in, then England’s waiting times performance deteriorates to 19.5 weeks as shown in the table below.
Three trusts resumed reporting in October – Barking, Havering and Redbridge University Hospitals NHS Trust, Walsall Healthcare NHS Trust, and Medway NHS Foundation Trust – so congratulations to them on sorting out their data problems.
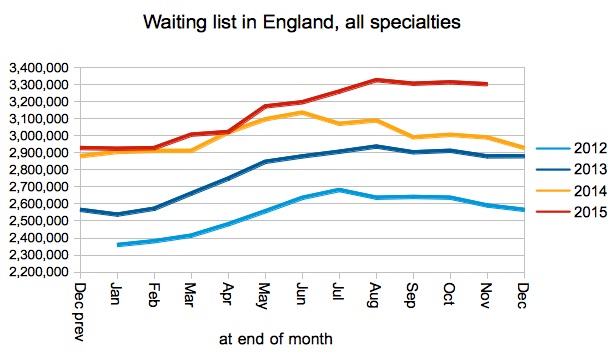
Did the waiting list grow in October? The official figures (which are charted below) suggest that it did, but then three trusts did resume reporting during the month. If we deduct those three trusts from October’s official waiting list then becomes 3,670,121, which is directly comparable with the official September figure of 3,702,578.
So in fact the waiting list shrank slightly during October. A shrinking waiting list is a good thing, but the trouble is it should be shrinking fairly rapidly at this time of year.
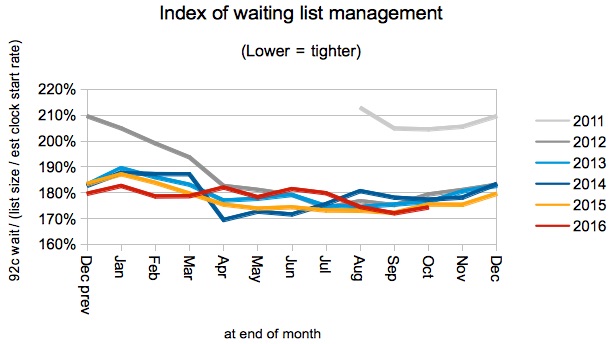
The red dot in the chart above is new, and estimates the waiting list size that is consistent with achieving the 18 week target in October. The calculation is deceptively simple: it is the current list size, divided by the current 92 per cent waiting time performance, multiplied by 18 weeks. This formula works so long as the index of waiting list management in the chart below can be assumed to be stable at different waiting times. And it can: although the index varies seasonally, it has otherwise remained stable through a range of waiting times since mid 2012 (I attribute the rapid improvement before then to the introduction of the incomplete pathways standard).
As waiting times grow across England, and the 18 week target moves further and further out of reach, there is a risk that people may start to give up on referral to treatment waiting times. If they do, then the index in the chart below will rise again. There is, fortunately, no sign of that happening yet.
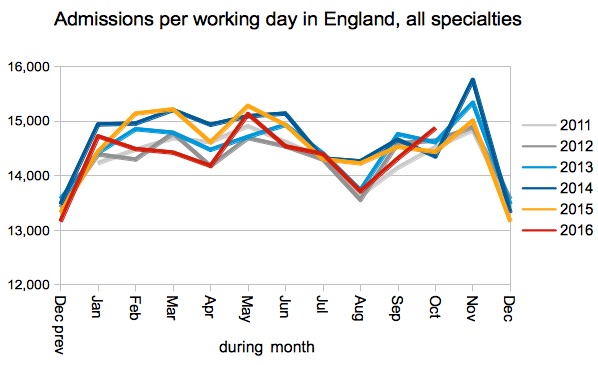
Admissions per working day were slightly higher in October, after being slightly lower in September. This is not enough to stop waiting lists and waiting times from growing, however.
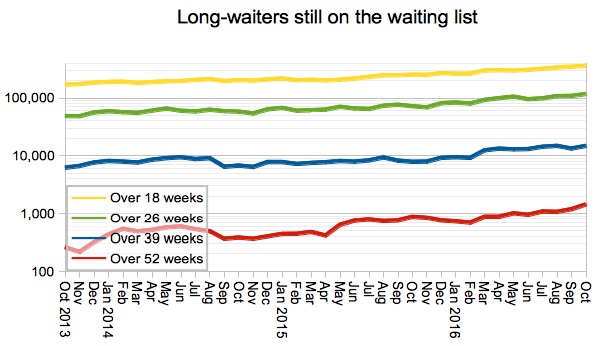
Ultra long waiters shot up as Imperial College Healthcare NHS Trust reported 474 one year breaches, compared with only 257 in September. The three trusts who resumed reporting contributed a further 88 one year waiters to the increase.
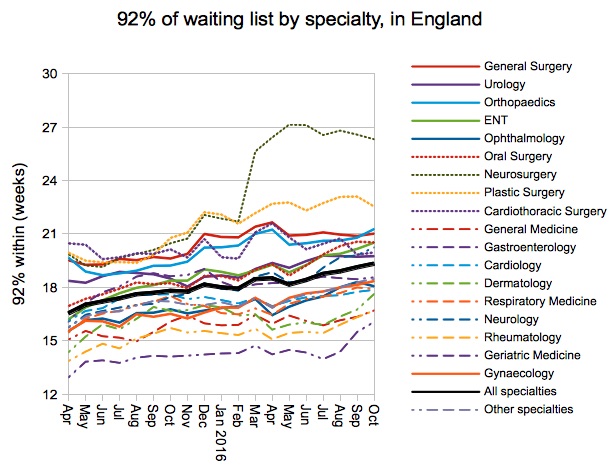
All surgical specialties remain in breach, although Ophthalmology edged closer to achieving the target again with a performance of 18.1 weeks.
The proportion of local services (at trust-specialty level) achieving the target fell again to just 68.7 per cent.
68.7 per cent is where the distribution below crosses 18 weeks. It is striking how the line is quite flat for services that are just inside 18 weeks, but then bends noticeably upwards for services who are in breach, suggesting that deterioration may speed up when the target has fallen. Which is why the index of waiting list management above may turn out to be important as waiting times rise.
Local detail
We’ve done some interactive maps showing the waiting times position by specialty for every Trust and CCG with significant waiting lists. If you want to look your own Trust up quickly, then visit our 18-weeks reports page.
All three trusts who resumed reporting have jumped straight into the top twenty this month, which is not uncommon when trusts have had recent data quality problems. Otherwise there is not much change in the table, although Lancashire Teaching Hospitals NHS Foundation Trust deserve a mention for improving their 92nd centile waiting times by 2 whole weeks since September.
Data for November 2016 (with revisions going back to April 2016) is due out at 9:30am on 12th January 2017.


