

For the first time since March 2008 there are officially more than 3 million patients on the English waiting list, according to the latest (May 2014) figures just released. In fact, because of data revisions, it turns out there were over 3 million back in April too. (Which means it turns out I was wrong to tick off the Labour Party for calling it last month.)
Three million is not just a nice round number: it is the start of the danger zone for breaching the high-profile target that 90 per cent of admitted patients should have waited less than 18 weeks (though the target was actually met in May). On past form we can expect the list to carry on growing for another couple of months, but only by about 100,000 patients. This takes us well into the admitted patient danger zone, but below the next danger point at around 3.3 million where the incomplete pathways target would be at risk too. (Also there is the £250 million elective care fund, which should hold the list size down a bit more than in recent years.)
Other than the headline list size, the story in May was of waiting times converging on 18 weeks. Those specialties and services who were breaching the ‘incomplete pathways’ 18-weeks target got better, and those who were comfortably within the target got worse. In short, May pretty much undid whatever happened in April.
In the following analysis, all figures come from NHS England. If you have a national statistic that you’d like to check up on, you can download our NHS waiting times fact checker. So if you hear any commentary about how much waiting times have worsened since the Coalition came into power, you can check up on the figures (hint: they haven’t).
England-wide picture
The waiting list grew, as it usually does at this time of year, and by the usual amount. What is significant is: firstly, that it takes us past 3 million to the largest list size since February 2008; and secondly that we are now well into the zone where the ’90 per cent adjusted admitted’ target is at risk (though it was not breached in May).
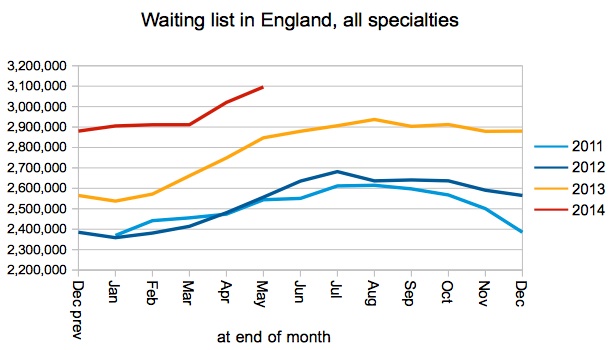
Waiting list in England
Admissions were slightly higher than in previous years, which is helpful but plainly not enough. We need to be shrinking this waiting list, by raising activity so that it exceeds demand.
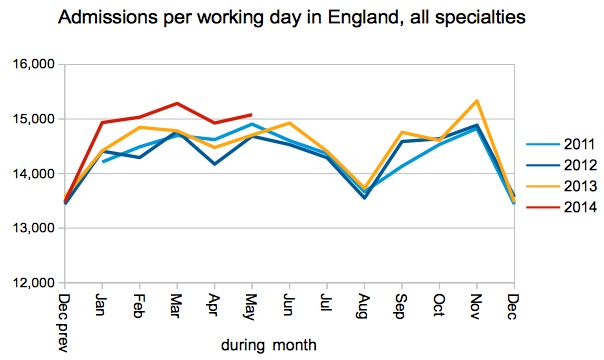
Admission rate
Longwaits got slightly worse in May 2014, but remain much better than they were a couple of years ago. They are also (despite what you might hear in the media) much better than they were at the last General Election (May 2010), even though the total list has grown 20.3 per cent since then.
Thus the number of over-18-week waiters on the list is down 7.5 per cent since the last election, over-26-week waiters are down 35.2 per cent, over-39-week waiters are down 75.3 per cent, and over-52-week waiters are down 96.9 per cent.
This is not to detract from the astonishing success of the last Labour government’s drive to achieve 18-week referral-to-treatment waiting times, but to show that the Coalition has consolidated and improved on that success since it came to power. Thanks, I would say, to the increased attention they have paid to the waiting list (incomplete pathways).
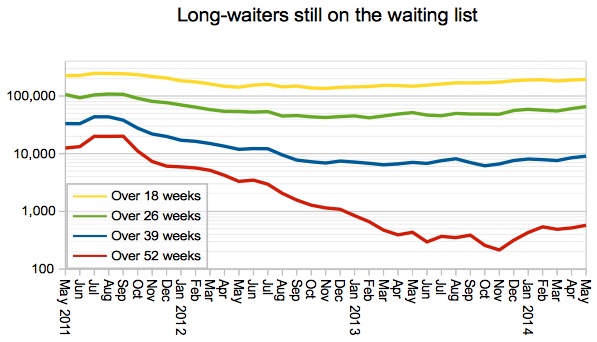
Long-waits on waiting list
The overall picture on my favourite summary measure is that the improvements in April have been undone in May.
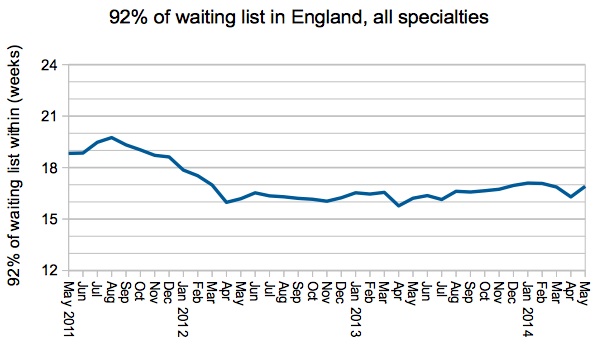
92pc of waiting list
At specialty level the reversals continue. Specialties that got worse in April improved in May, and vice versa. At the same time they converged on 18 weeks; the worst improved and the best declined. The exception is Urology, which continued its long slow decline and started breaching 18 weeks for the first time since March 2012.
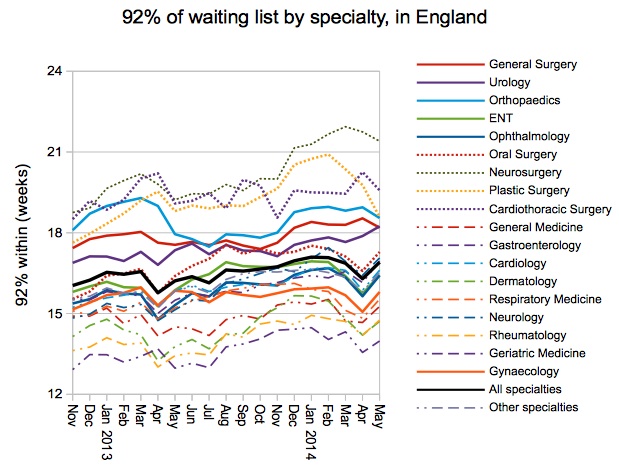
92pc of list by specialty
The proportion of specialties at provider level, who are achieving the 92 per cent incomplete pathways target, remained steady. But…
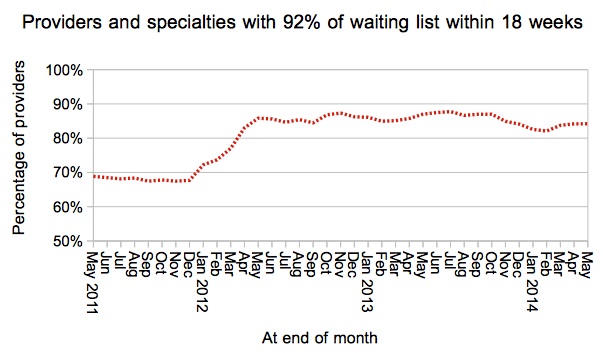
Provider-specialties within 18 weeks
The distribution changed. Again we can see that those services who were breaching got better, and those who were inside the target got worse. If this carries on, it will look like the NHS is treating “18 weeks” literally as a “target” to be hit as accurately as possible, instead of a backstop to remain comfortably below.
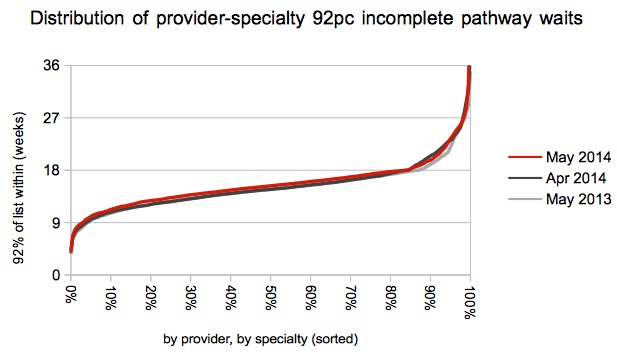
Distribution of 92pc waits by provider-specialty
Local detail
There are interactive maps showing the all-specialties position at every Trust and CCG. For specialty-level analysis at a particular Trust, independent sector provider or CCG, visit our 18-weeks reports page.
Not a lot of change in this month’s table, except that Great Western have popped up from nowhere (well, 83rd place) to number 8 on our table, with a whopping 56 one-year breaches. Perhaps they have found some patients who weren’t previously being reported; if that’s the case, then well done them for coming clean, and now that they know about those patients they can get them treated quickly.
Five Trusts did not report their waiting lists: Barking, Havering and Redbridge University Hospitals NHS Trust, Barnet and Chase Farm Hospitals NHS Trust, Tameside Hospital NHS Foundation Trust, Walsall Healthcare NHS Trust, and The Whittington Hospital NHS Trust. Which means that Derby have returned to reporting data after installing their new IT system: well done.
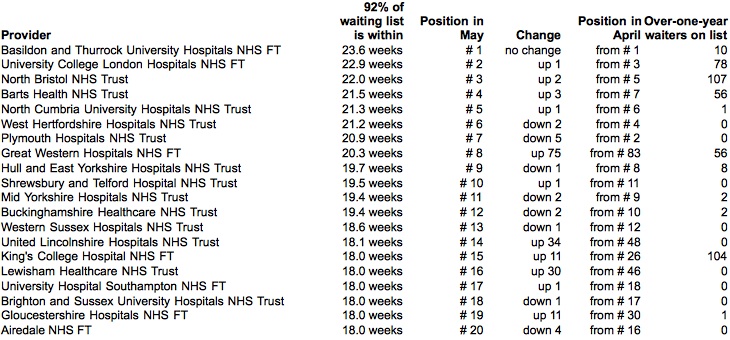
Top twenty
Congratulations to five Trusts for dropping out of the table: Taunton and Somerset, Alder Hey (just), Heatherwood and Wexham Park, Cumbria Partnership, and Oxford University Hospitals.
Data for June 2014 is due out at 9:30am on Thursday 7 August 2014.