

The English waiting list probably topped 3.2 million in June, which brings us closer to the next danger level of 3.3 million when even the “92 per cent incomplete pathways” target comes at increased risk of a national-level breach. On past form we would expect further growth in the list in July and perhaps August, so there may be worse to come (or not, if the elective care fund is successful).
The high-profile target that 90 per cent of admitted patients should have waited less than 18 weeks was narrowly failed in June. This was intentional. This target is failed when hospitals admit lots of long-waiting patients, and the NHS is currently trying to treat its long-waiting patients to clear the backlog and get everything ship-shape for the run-up to the General Election.
What is worrying is that this deliberate breach is so far having no visible effect on the proportion of long-waiters remaining on the waiting list. But it is only fair to note that the national waiting list initiative only really got going in July, so perhaps we will start seeing results in next month’s figures.
In the following analysis, all figures come from NHS England. If you have a national statistic that you’d like to check up on, you can download our Gooroo NHS waiting times fact checker
England-wide picture
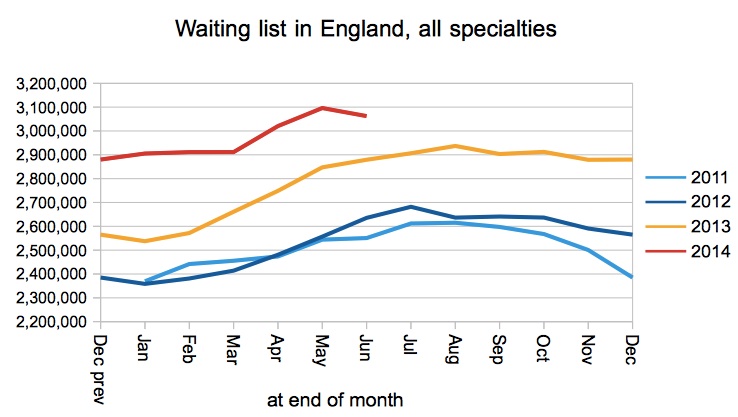
From the chart below, it looks like the English waiting list shrank in June. But don’t get too excited. Barts Health NHS Trust did not submit any referral-to-treatment (RTT) data in June because of IT woes, and they have easily the biggest waiting list in the country (72,519 patients on their May figures). Helpfully, NHS England are now officially estimating the total English list size with the missing Trusts added back in, and they reckon the total list “may have been just over 3.2 million patients”.
It isn’t an exact science, but I estimate that 3 million is roughly the level at which the “90 per cent adjusted admitted” target becomes hard to sustain, and 3.3 million is roughly where the more important “92 per cent incomplete pathways” target is put at risk. So with another month or two of waiting list growth expected this year, things are looking tight.
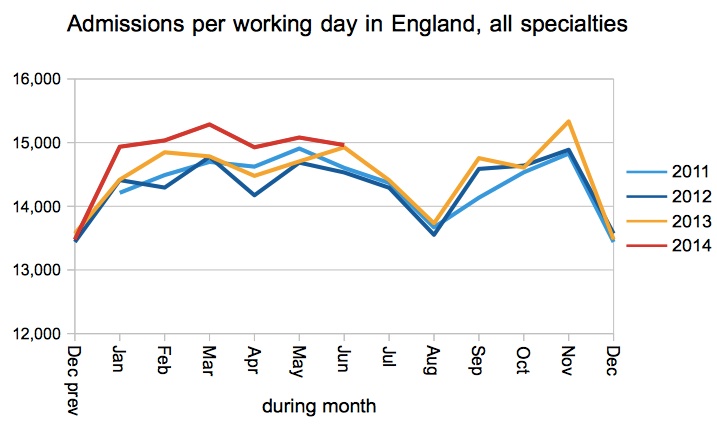
The rate at which the NHS is admitting patients was bang on last year’s level, which plainly isn’t enough given the growing waiting list. Next month we would hope to see an increase relative to recent years, if the £250 million elective care fund is successful at raising the admission rate in July and August as intended.
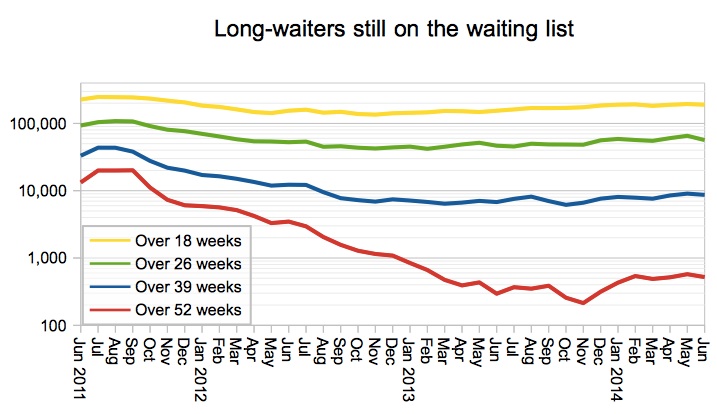
Despite treating enough long-waiters to breach the “90 per cent adjusted admitted” target, the number of long-waiters remaining on the waiting list has hardly budged. This suggests that the breach was a consequence of maintaining England’s oversized waiting list, and was not caused by any particular efforts to treat the longest-waiters on the list. Here’s hoping for something more dramatic in next month’s figures.
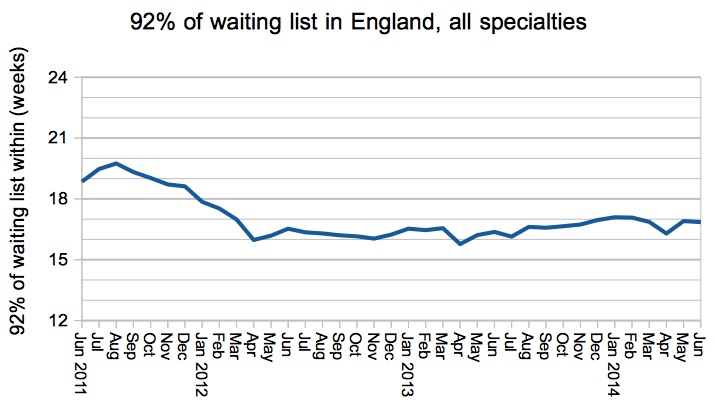
Similarly, 92nd centile waiting times have hardly budged for patients still on the waiting list. On the other hand it hasn’t worsened either, which is the fear as the total list size rises towards 3.3 million.
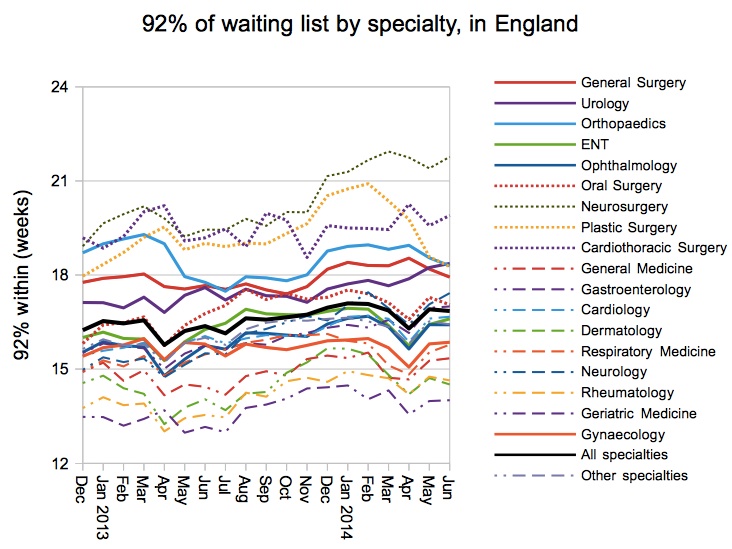
Whatever is going on in Plastic Surgery seems to be working, because waiting times have been plummeting since February, and could get back inside 18 weeks in next month’s figures. General Surgery narrowly restored 18-weeks compliance, while Urology fell further into breach territory.
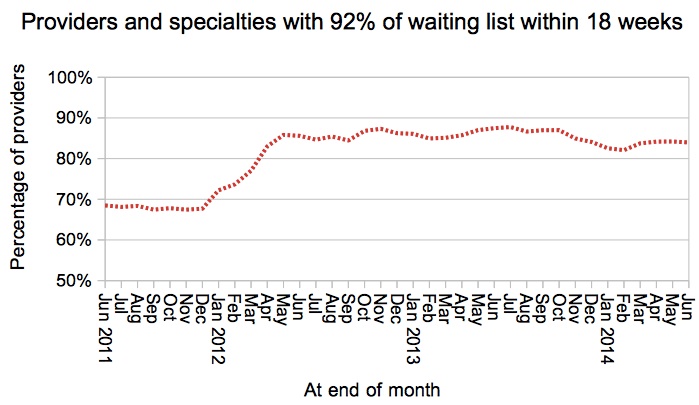
So far there is no indication of a stampede towards success among local services, but again June was very early in the backlog clearance initiative so let’s wait for an improvement in next month’s figures.
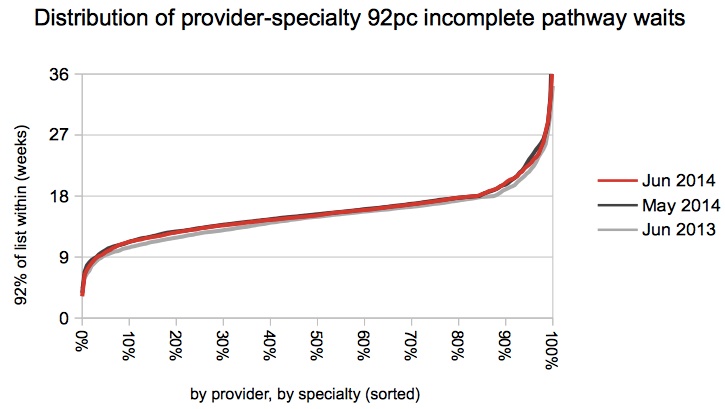
In keeping with this general treading of water, the distribution of waiting times hardly budged either.
Local detail
There are interactive maps showing the all-specialties position at every Trust and CCG. For specialty-level analysis at a particular Trust, independent sector provider or CCG, visit our 18-weeks reports page.
Lincolnshire have galloped up the chart and now have the 3rd longest waiting times in England (excluding any of the 5 non-reporting Trusts who may be ahead of them). The lower part of the table sees some surprise entries from Trusts who had been performing much better, including Mid Cheshire where 92 per cent of their waiting list was within 15.6 weeks at the end of May but popped out to 18.4 weeks in June.
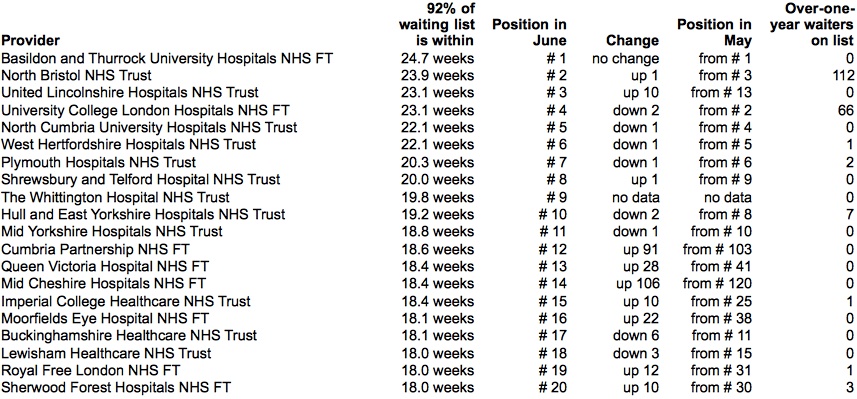
Congratulations to Airedale for dropping out of the table, with 92 per cent of their list now within 16.9 weeks (down from 18.0 weeks in May). Also to Great Western for dropping out with an improvement from 20.3 to 17.9 weeks, although they did still have 84 one-year-waiters on their list so there is more to do.
Data for July 2014 is due out at 9:30am on Thursday 11 September 2014.