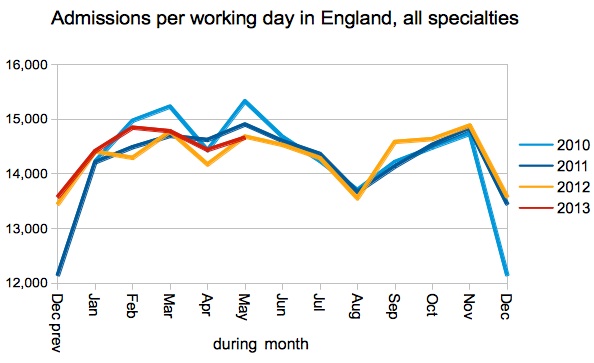
The English NHS unexpectedly managed to stop the official waiting list from breaching 3 million patients in March, helped along by a year-end surge in admissions, and the failure of yet another Trust to complete its data return.
The target that 90% of admitted patients must have waited less than 18 weeks was breached again. This was expected, and signifies both that the NHS has a waiting time problem (caused mainly by the over-large waiting list) and that it is trying to do something about it.
The target that 92% of patients still on the waiting list must be within 18 weeks was met, and performance on this measure actually improved slightly.
Seven Trusts are now failing to submit complete sets of waiting times statistics, and this is having a significant effect on the national data. There is usually a perfectly reasonable explanation when a Trust does not report data (e.g. massive IT or recording failures), but with nearly 5% of the waiting list now missing it is surely time for NHS England to explain why.
In the following analysis, all figures come from NHS England. If you have a national statistic that you’d like to check up on, you can download our waiting times fact checker
England-wide picture
Yet another Trust stopped reporting its waiting list data, bringing the total number of non-reporting Trusts to seven. The last known position at each Trust was:
If you take the reported national waiting list size for March (2,911,442), and add back the last-reported list sizes for the 7 missing Trusts (140,536), you get a total list size of 3,051,978. For comparison, if you do the same for February’s figures (adding back the 6 Trusts who were missing then) you get 3,011,956. That’s a big enough adjustment to erase most of the hopeful-looking improvement in the chart below.
It also suggests that the waiting list has already passed 3 million, but as I said last month let’s mark this milestone ‘clean’ in the official data when it happens. It’s only a nice round number after all; what matters is the effect that any given list size has on waiting times.
Admissions per working day were markedly up in March, which is good news and will help keep the size of the waiting list under control.
There is now a push from the centre to bring waiting times down again. But it needs to be understood that, if a waiting list is in established growth (as the English list is), then you need to raise baseline activity if that growth is to be arrested or reversed. A ‘waiting list initiative’ will not suffice; after the surge is over, the list will just grow back again.
With 7 Trusts failing to report waiting list data it is hard to know what the real position might be on very-long-waits. In March, 43 Trusts reported having any one-year-waits, down from 46 at the end of February.
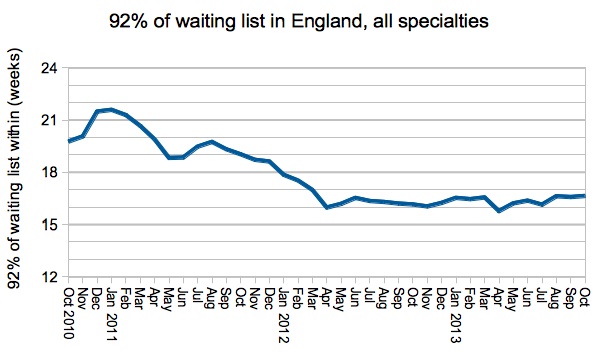
Performance on my favourite measure (how long 92 per cent of the waiting list has waited) improved slightly in March.
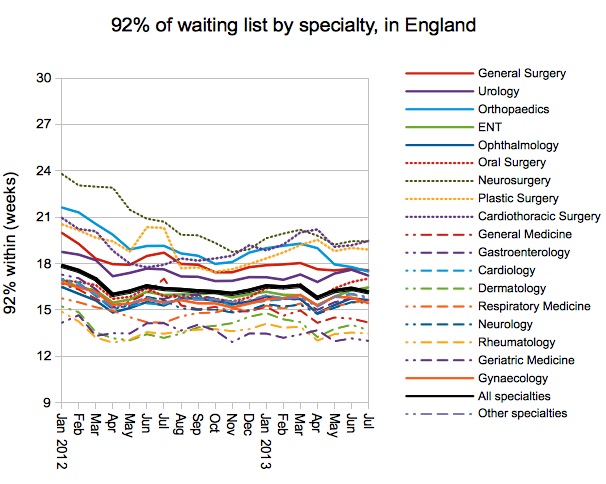
That improvement was reflected in most specialties, with the exception of neurosurgery which continues to deteriorate.
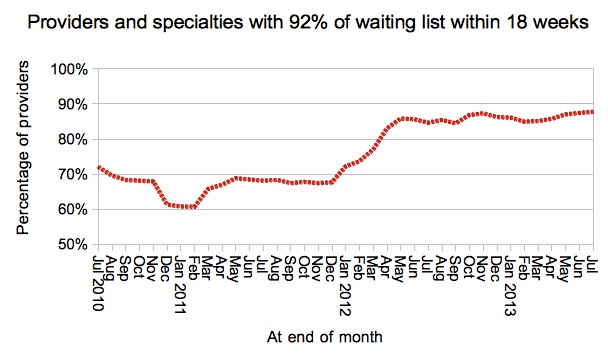
The proportion of services meeting the ‘92% of the waiting list within 18 weeks’ target improved slightly. This proportion is measured across 2,455 specialties where at least 100 patients were on the waiting list, including both NHS and independent sector providers.
The previous chart tracks where the red line crosses 18 weeks on the next chart. Curiously, there was a marked improvement in waiting times at the shorter-wait end of the spectrum. Unfortunately I have no idea why that might be.
Local detail
Follow these links for interactive maps showing the all-specialties position at every Trust and CCG. For specialty-level analysis at a particular Trust, independent sector provider or CCG, visit our 18-weeks reports page.
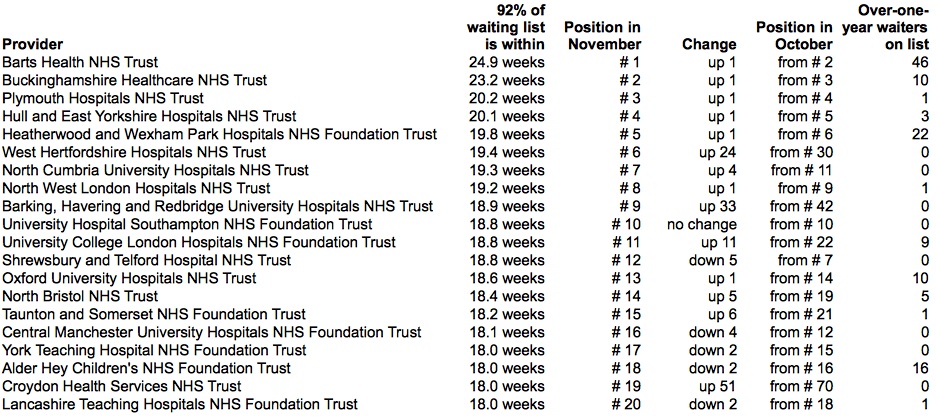
There was very little movement at the top of the provider table in March. But when checking out the rankings, remember that 7 Trusts did not report their waiting list data.
Circle Reading continue to bounce up and down the table, and in March they improved from 12th to 68th position, shortening waits from 92% within 19.7 weeks to 16.9 weeks. Congratulations also to Taunton and Somerset who improved from 17th to 46th place (18.4 to 17.4 weeks), and the Queen Victoria Hospital who improved from 13th to 42nd place (19.4 to 17.5 weeks).
Data for April 2014, which is the new favourite for the English waiting list topping 3 million, is due out at 9:30am on Thursday 12 June 2014.


