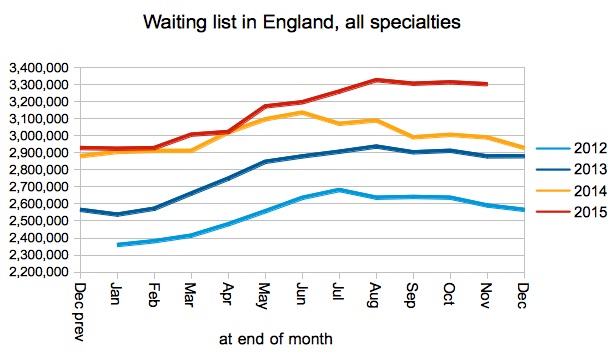
England’s waiting list remained stubbornly large in November, and showed no signs of the seasonal shrinkage that usually comes with autumn. The omens for the next few months are not good. The waiting list has historically grown between November and March in every year since 2012, which was the year the general decline in waiting list and waiting times performance set in.
We can therefore expect the waiting list to be much larger at the end of March 2019 than it was at the start of the financial year, in defiance of this year’s planning guidance.
Things were more positive on the planning guidance’s other elective “ask” about reducing one year waiters – these have been falling decisively since the summer. But there is still a long way to go. The ambition is to halve them over this financial year, and they have only just got back below the starting point.
For analysis of waiting times performance at a particular organisation, visit our reports page. You can also access maps of the latest waiting times across England for A&E, cancer, and RTT.
In the following discussion, all figures come from NHS England. If you have a national statistic that you’d like to check up on, you can download our RTT waiting times fact checker
England-wide picture
Waiting times trod water in November.
The list of non-reporting trusts did not change either.
The waiting list remains large with none of the seasonal shrinkage that we usually see in a ‘good’ year. It is therefore a racing certainty that, when seasonal list growth returns in February and March, the financial year will end with a much larger list than it started.
The apparently widening gap that opened up between this November’s list and the previous year’s is actually an artefact of Mid Essex Hospital Services NHS Trust ceasing reporting in late 2017. However the adjusted figures confirm that the gap between the 2017 and 2018 list sizes widened in April and May and has remained wide ever since.
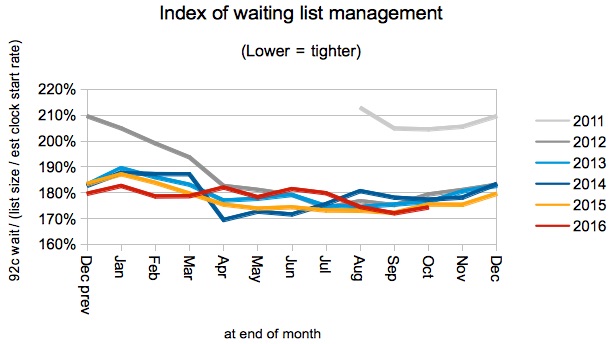
The index of waiting list management, which sweeps up all the drivers of waiting times other than list size, remains at the elevated level that began in August 2017.
Admissions per working day remain low compared with recent years, and on a par with last year. This again does not fulfil the promise of the planning guidance which suggested that “The 2018/19 allocations now allow for improvements in the volume of elective surgery being funded”.
In a rare bit of better news, the number of one year waiters is still coming down. It did start the financial year by rising sharply, and in November it only just got back to the starting point. If it carries on falling at this rate over winter then it is not impossible that one year waiters could halve over the financial year, as the planning guidance asked. But winter is always a tricky time for the complex elective surgery which tends to dominate ultra long waits.
To put a bit of historical context on this… the smallest ever number of one year waiters was 214 in November 2013, and just over ten years ago there were more than 100,000.
In another small bit of good news, General Medicine scraped back inside 18 weeks for the first time since May 2018. Only they and Geriatric Medicine are achieving the 18 week standard at national specialty level.
Local detail
The proportion of local services achieving 18 weeks improved slightly, delaying the day when fewer than half of local services are within the standard. That day may come this winter.
The distribution hardly budged month-on-month, although the year-on-year pattern of rising waits is evident.
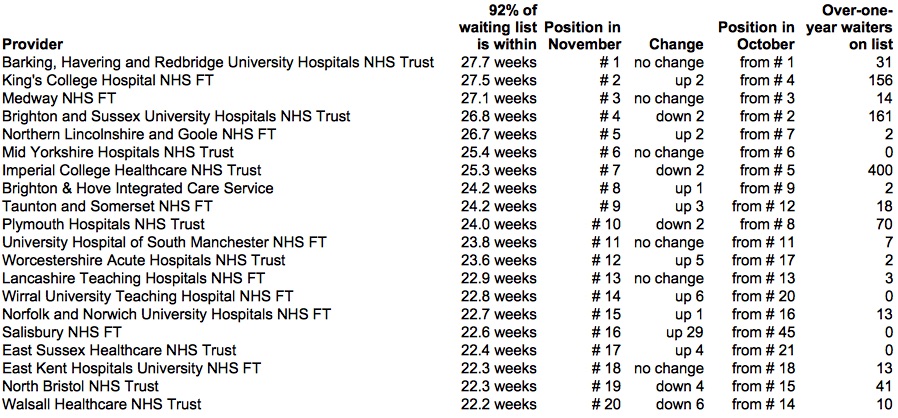
By coincidence both Basildon and Thurrock University Hospitals NHS Foundation Trust, and Brighton and Sussex University Hospitals NHS Trust, rose nine places in the rankings of long-waiting providers, and both ended up with waits of 27.0 weeks.
Referral-to-treatment data for December 2018 is due out at 9:30am on Thursday 14th February 2019 – Valentine’s Day.


