

In the penultimate month of England’s national waiting list initiative, the NHS admitted the smallest number of patients per working day of any October in the last 4 years. Not quite what you might expect during a £250 million investment in extra treatments.
The bad news didn’t end there. The number of over-18-week waiters on the list went up when it should have gone down. And whereas you might expect the longest-waiting services to improve the most during a waiting list initiative, the distribution of long-waits hardly budged.
The only speck of good news in an otherwise dismal set of figures was that the number of apparently perversely-managed services fell to a record low, exactly what you would want during the amnesty on perverse targets. Only 10 provider-specialties kept to the admitted and non-admitted targets even though they were breaching the easier incomplete pathways target at the start and end of the month. In plain English: even though they had lots of long-waiters on their lists, they apparently chose not to treat them because a perverse target that isn’t officially being enforced said they shouldn’t.
The amnesty on perverse targets finished at the end of November, and we are likely to see the consequences in the December figures (which will be published in early February). Then we shall see if the Secretary of State kept his word.
In the following analysis, all figures come from NHS England. If you have a national statistic that you’d like to check up on, you can download our Gooroo NHS waiting times fact checker
England-wide picture
The list of Trusts who did not report their waiting list data is unchanged from September. These missing Trusts make a significant difference to the reported list size, so here are their last-known positions:
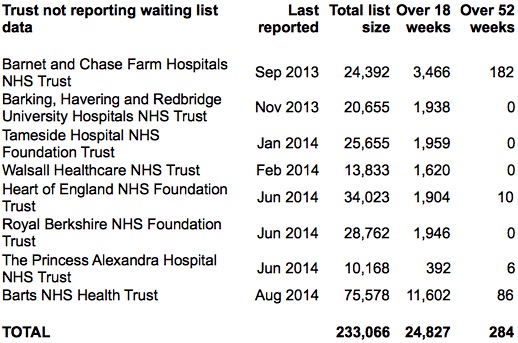
Non-reporting Trusts
These missing Trusts are excluded from the chart below, and if you add them back in then the total waiting list size comes to 3,238,972. This is uncomfortably close to the 3.3 million level where I estimate that 18 weeks becomes unsustainable, even on the loosest target that 92 per cent of the waiting list must be within 18 weeks. The list remains well above the 3 million mark where I estimate that the 90 per cent admitted target becomes unsustainable.
This small increase in the total number waiting is not unusual for an October, but it is disappointing at a time when the list should be shrinking because of the national waiting list initiative.
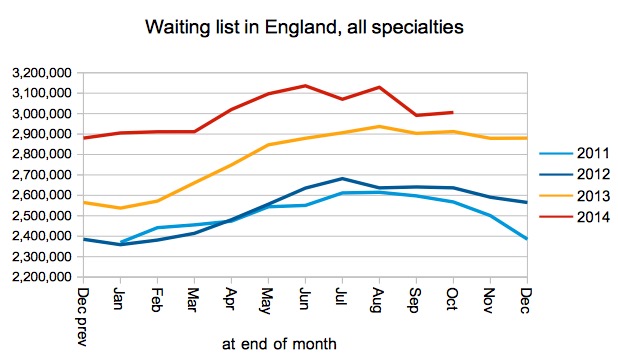
Size of waiting list
The number of admissions per working day was the lowest of any October in the last four years. It does rather make you wonder what the £250 million elective care fund has been spent on.
In better news, the number of long-waiters over 18 weeks who were admitted remained relatively high at 36,313, only slightly lower than September’s 37,712 and a lot better than the previous October’s 28,866. This was helped along by the amnesty on the perverse ‘admitted patient’ target, which normally limits the number of long-waiters that Trusts are allowed to admit. Normally 90 per cent of admissions should be under-18-week waiters, and the ‘managed breach’ amnesty allowed the NHS to treat more long-waiters and achieve 89 per cent instead.
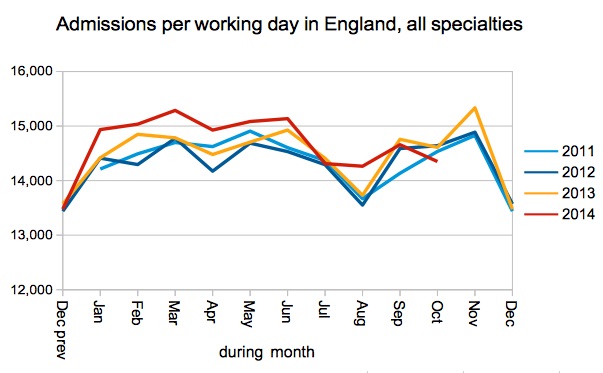
Admissions per working day
Despite all the efforts to treat plenty of long-waiters, the number of over-18-week waiters remaining on the waiting list went up. This is a consequence of the total size of the waiting list being too large, which means that large numbers of patients are feeding through the waiting list all the time. Although the increase was small, in a successful waiting list initiative you would expect to see a decisive decrease.
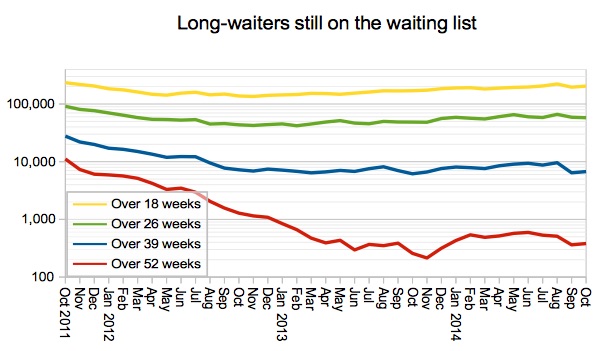
Long-waiters still on waiting list
Performance against my preferred measure – how long 92 per cent of the waiting list is waiting – deteriorated slightly in line with other indicators. I prefer this measure because it is not as sensitive to effects such as non-reporting Trusts, and (unlike the admitted and non-admitted figures) reflects the waiting list itself as opposed to the management action being taken on it.
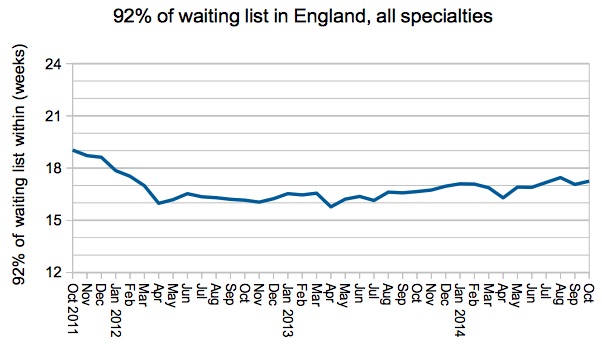
92pc of waiting list within
At specialty level the convergence on 18 weeks continued. There was a welcome improvement in waiting times in the longest-wait specialties of Neurosurgery and Cardiothoracic Surgery, but other specialties mostly headed up towards the 18 week mark. Orthopaedics narrowly returned to breach territory, after briefly achieving the target in September.
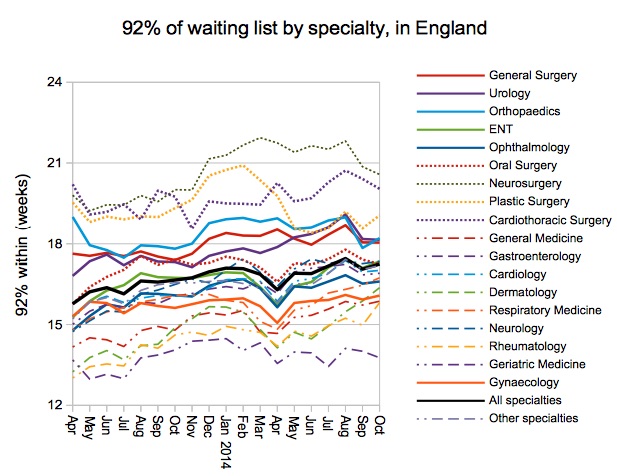
92pc of waiting list by specialty
The proportion of specialties at provider level, who achieved the target that 92 per cent of the waiting list should be within 18 weeks, declined slightly in October.
Even when overall waiting times were at their best, more than 10 per cent of hospital services still had lots of long-waiting patients on their lists. This is worth remembering if you hear claims that the national waiting list is now in good enough shape to end the amnesty on the perverse targets; not every service has short waits, so perverse targets will still cause patients in those services to be stranded the wrong side of 18 weeks.
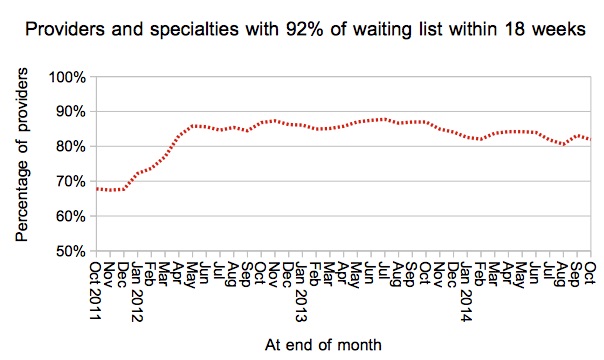
Services achieving 92pc within 18 weeks
The red line in the chart above tracks where the red line in the next chart crossed the 18 week line. This is the distribution of long-waits: how long 92 per cent of patients waited, by specialty, by provider. In a well-targeted waiting list initiative, you would expect the longest waits to improve the most. But as you can see, the distribution hardly budged in October.
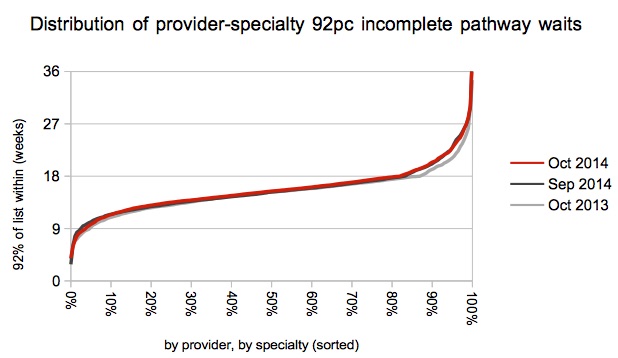
Distribution of 92pc waits by service
Local detail
There are interactive maps showing the all-specialties position at every Trust and CCG. For specialty-level analysis at a particular Trust, independent sector provider or CCG, visit our 18-weeks reports page.
Lincolnshire remain at the top of the long-waits table for a second month, with second place going to North Bristol who also have the largest number of one-year waiters. (The apparent movement in the table is caused by Peninsula, who did not appear in the September table because their volumes fell below the threshold used to exclude very small providers from the table.)
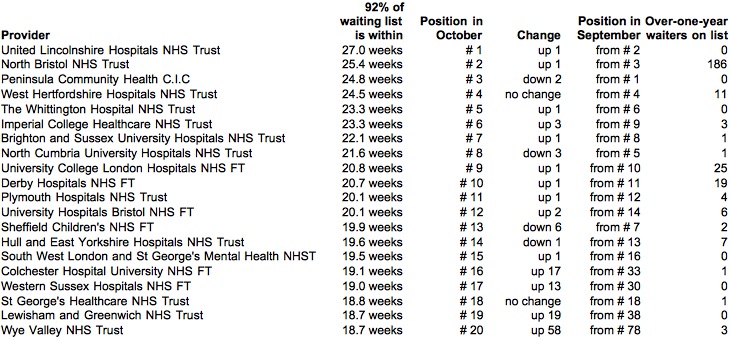
Top twenty
Congratulations to Southend for dropping out of the table from 19th to 57th place, with an improvement in 92nd centile waits from 18.1 to 17.3 weeks. Also to Chelsea and Westminster, who dropped from 17th to 44th place (18.4 to 17.7 weeks).
Data for November 2014, the last month of the national waiting list initiative, is due out at 9:30am on 15 January 2015.