

Records tumbled in November as the NHS sprinted for the finishing line on England’s waiting list initiative. The admission rate per working day was the highest in many years, as was the proportion of treatments directed at tackling long waits.
The result? Nothing.
The size of the waiting list, and the position on long-waiters, hardly budged. It looks like all this ‘extra’ work may not be extra at all, and should instead be part of the normal capacity that is now needed to keep up with demand.
The end of November was a pivotal moment for English waiting times. It was the last month of the national waiting list initiative, and of the amnesty on those perverse targets that normally restrict hospitals from treating their long-waiting patients.
It is also when the English waiting list is supposed to have become sufficiently small and trim that all three 18-week targets can then be safely sustained. As Jeremy Hunt put it in August: “The truth is we need to ensure both that 90% of people get their treatment within 18 weeks – the official target – and that people who are not treated within that period are not neglected. So I have set a timeframe of this calendar year to deliver on both of those objectives.”
So from 1st December all the 18-week targets – including the perverse ones – came back into force. From 1st January they were all strengthened: under the yet-to-be-finalised draft NHS Contract 2015-16, CCGs are encouraged to apply all available sanctions and required to publish the extent to which they did so. Unless the draft Contract is amended then all fines are set to increase by 25 per cent and become mandatory from April.
Then there’s the little matter of the General Election. The last figures to be published before the election will show performance at the end of February, and the Government would dearly love to show three clear months when all the 18-week targets were met. Which is why all the targets are coming back into force with such vengeance. Can it be done?
The English waiting list is probably too big to safely sustain all three 18-week targets indefinitely. But for the three crucial months to February, it may be possible to squeeze everything hard and get the numbers to come out right. Yes, there are perverse targets that restrict hospitals from treating long-waiters. Yes, that will mean more long-waiters are stranded on the waiting list. No, it won’t push the NHS into national breaches overnight; the incomplete pathways target could probably survive beyond February. And no, the way it would be achieved would not be pretty, nor fair to long-waiting patients.
In the following analysis, all figures come from NHS England. If you have a national statistic that you’d like to check up on, you can download our Gooroo NHS waiting times fact checker
England-wide picture
The list of Trusts who failed to report any waiting list data has not changed since September. These missing Trusts make a significant difference to the reported list size, so here are their last-known positions:
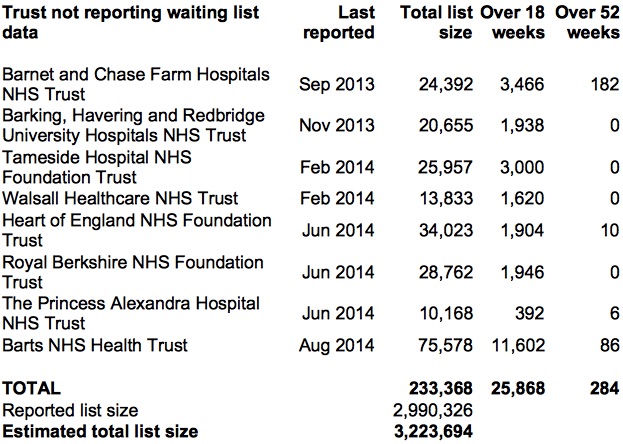
Non-reporting Trusts
In a normal year we would expect to see the waiting list shrinking in November as it heads for the seasonal low in January. This year, we would expect to see it shrinking even more rapidly because of the national waiting list initiative. In fact, it didn’t shrink at all. (The following chart omits non-reporting trusts.)
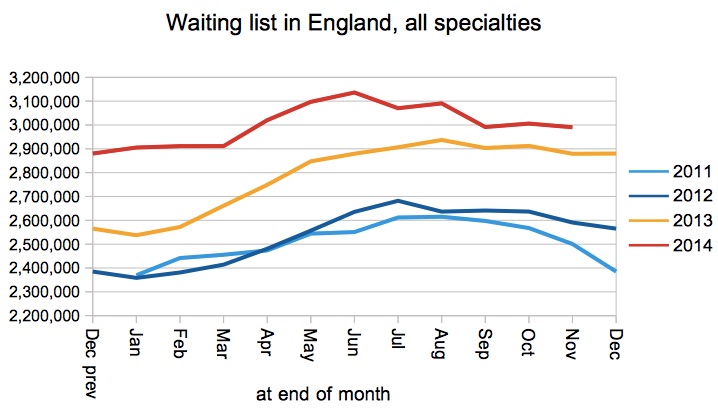
Waiting list in England
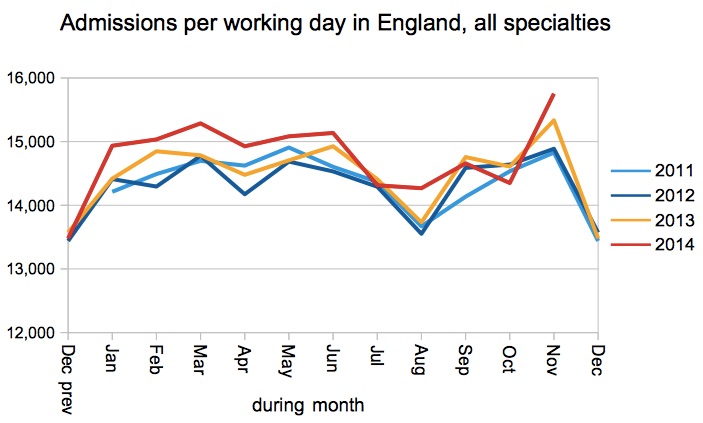
This wasn’t for lack of trying. Admissions per working day were certainly the highest since 2009 and possibly the highest ever recorded. Non-admitted numbers were high too. So how come the waiting list didn’t shrink?
The English waiting list has been in established growth for two years, and that means baseline activity is not keeping up with demand. So when ‘extra’ activity is laid on, it doesn’t all go towards reducing the waiting list; the first call is to make up the shortfall against demand, and then if anything is left over afterwards then that is used to shrink the waiting list. It seems in November that almost nothing was left over.
Admissions per working day
Similarly, there was no significant change in the numbers of long-waiting patients left on the list. Again, these figures exclude those Trusts who did not report waiting list data.
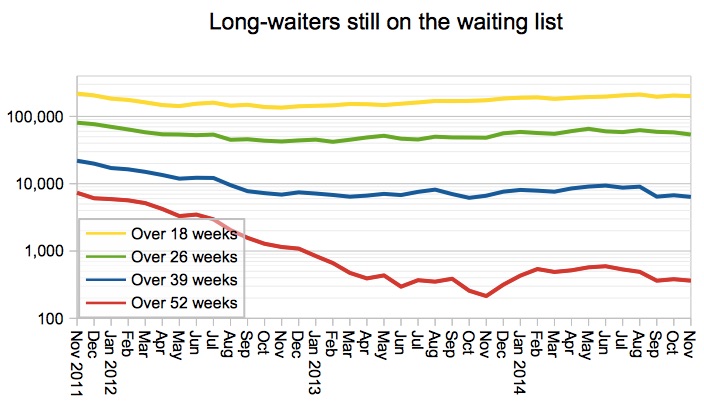
Long-waiters still on waiting list
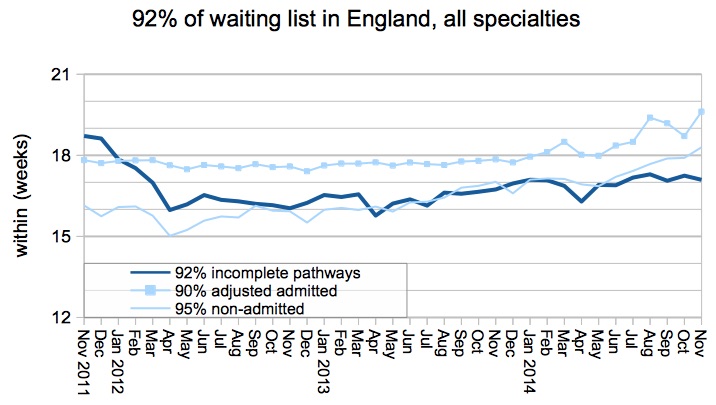
I’ve changed the next chart because it shows an interesting story when all three 18-week measures are plotted together. Remember that only the incomplete pathways line shows the actual waiting list; the other two lines reflect the patients the NHS chose to treat. Or, put another way, incomplete pathways show the problem, the other measures show the NHS’s response to the problem.
We can see that the admitted target was breached in February, recovered briefly, and was then breached with increasing enthusiasm over the summer as the amnesty made it easier for hospitals to treat their long-waiting patients. Even the non-admitted target, which had never been breached since it was first achieved in July 2008, crept up and joined the fun in the final month.
What will happen next? From December we can expect the admitted and non-admitted lines to drop sharply as the targets are reinstated and reinforced. The incomplete pathways performance – the only one that really matters – will then be in a similar position to late 2013, when the waiting list was failing to achieve its seasonal shrinkage and hospitals were restricted from treating long-waiting patients.
If incomplete pathway waits were to rise now by the same amount as they rose last year, then they would not breach the target in any statistics published before the General Election. And after that? A breach could not be held off forever unless baseline activity can be brought into line with demand.
92pc of waiting list within
At specialty level, neurosurgery has continued to improve and no longer has the worst waiting times, and urology has popped back inside the target again.
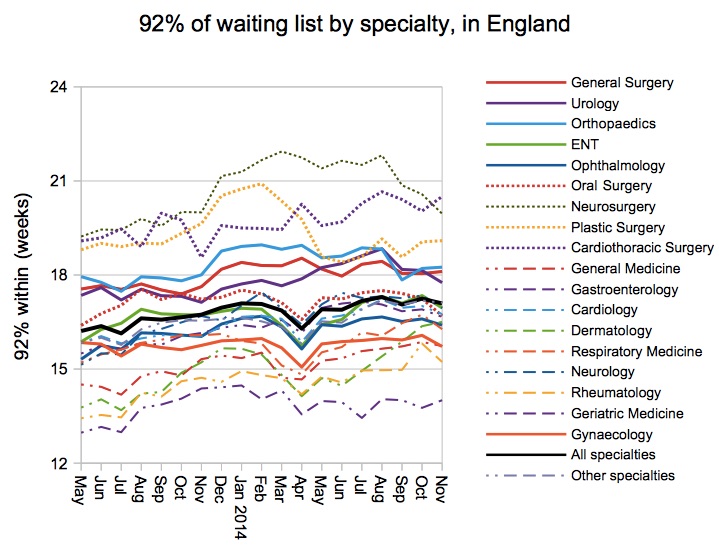
92pc of waiting list by specialty
432 Trust-specialties (out of 2434, excluding small services) breached the target that 92 per cent of the waiting list (incomplete pathways) should be within 18 weeks – about the same as October.
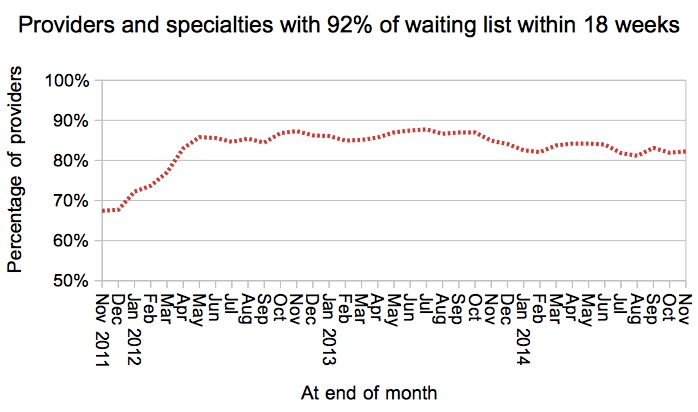
Provider-specialties achieving incomplete pathways target
Most of the improvement was at the shorter-waiting end of the spectrum, which is not what you might expect in a targeted waiting list initiative.
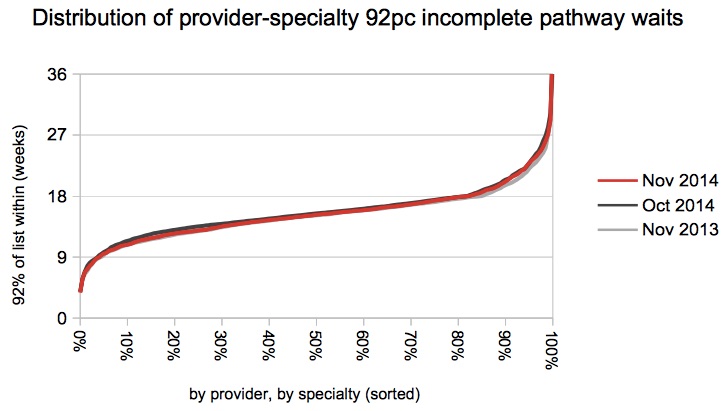
Distribution of provider-specialty waits
Local detail
There are interactive maps showing the all-specialties position at every Trust and CCG. For specialty-level analysis at a particular Trust, independent sector provider or CCG, visit our 18-weeks reports page.
Lincolnshire have improved their waiting times and escaped the top of the table this month. The surprise new entrant is Chesterfield, where 92nd centile waiting times for incomplete pathways jumped from 17.6 to 21.7 weeks during November.
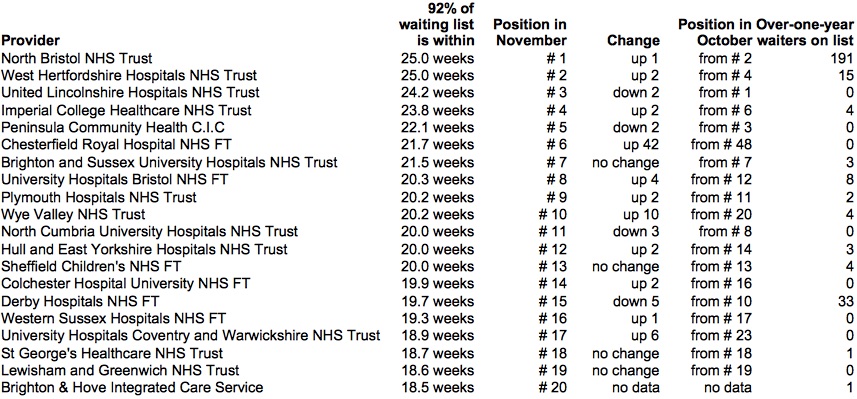
Top twenty
Congratulations to The Whittington for dropping all the way from 5th to 37th place as 92nd centile waits fell from 23.3 to 17.8 weeks. Also congratulations to UCLH who went from 9th to 33rd place by improving waits from 20.8 to 17.9 weeks.
Data for December 2014, the first month with all targets reinstated, is due out at 9:30am on 12 February 2015.