

The English NHS admitted record numbers of long-waiting patients in August in an effort to clear the backlog. Yet long-waits got worse.
The waiting list is now so large that even the ‘incomplete pathways’ target is at risk of failure in the coming months.
The summer waiting list initiative has been extended to November to try and rescue the situation, but the bulk of the work was supposed to be planned for July and August. So the prospects for waiting times in the run-up to the General Election are worsening, and it is now unclear whether the 18-week targets can be achieved through the period December 2014 to February 2015 as intended.
The underlying problem is that the waiting list has been growing rapidly for the last two years. That growth points to a shortfall of baseline activity against demand, and the growth needs to stop or things are only going to get worse. This is a recurring problem, and it really needs a recurring solution not a one-off waiting list initiative. Whoever wins the next election will have to deal with this somehow, but in the meantime all eyes are on the short term.
In the following analysis, all figures come from NHS England. If you have a national statistic that you’d like to check up on, you can download our Gooroo NHS waiting times fact checker
England-wide picture
Walsall and Barts have started submitting data again, so well done to both of them. The list of Trusts who did not report their waiting list (incomplete pathways) data, together with their last reported figures, is shown in the following table.
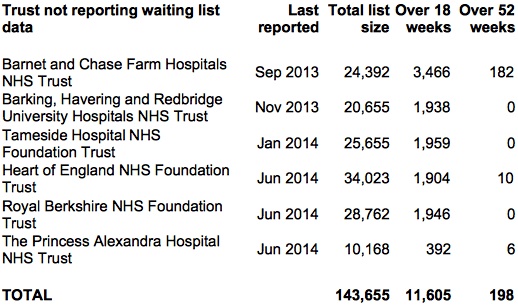
Non-reporting Trusts
The chart below shows the total waiting list size, but it misses out these non-reporting Trusts. If you add in their last known positions the English waiting list comes to 3,272,625, which NHS England have rounded up in their Statistical Press Notice to “just under 3.3 million patients”.
Not only is 3.3 million the biggest waiting list since January 2008, it is also the point where I reckon the ‘incomplete pathways’ target starts to be at risk of failure.
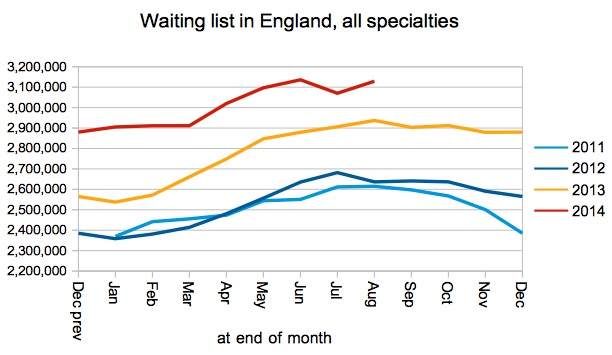
Waiting list in England
The NHS pulled the stops out in August, admitting far more patients per working day than in recent years.
The effort to clear the long-waiting backlog was even bigger, with 34,414 over-18-week waiters admitted in August (on an adjusted basis), compared with just 22,442 in August 2013.
Hospitals are currently being allowed to breach the target that 90 per cent of admitted patients should be under-18-week waiters (adjusted for clock pauses). This is a sensible move to allow them to clear their backlogs of long-waiters. Because they admitted so many long-waiters in August, performance against the adjusted admitted target was only 87.9 per cent which is the lowest since April 2008.
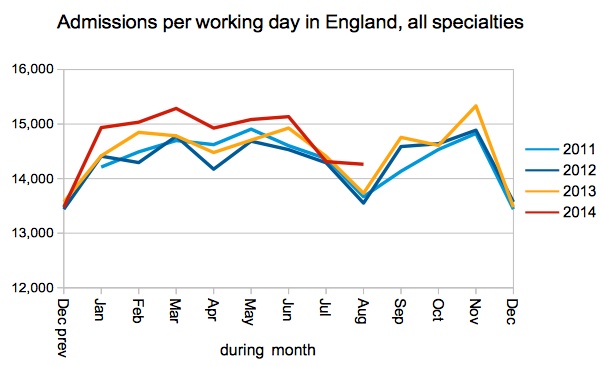
Admissions per working day
In spite of these efforts to treat long-waiters, the number of over-18-week waiters remaining on the waiting list actually went up during August by around 7 per cent (allowing for non-reporting Trusts).
Considering that the whole point of the summer waiting list initiative was to reduce the number of long-waiters, and that the lion’s share of progress was supposed to have happened in July and August, the lack of any progress is worrying.
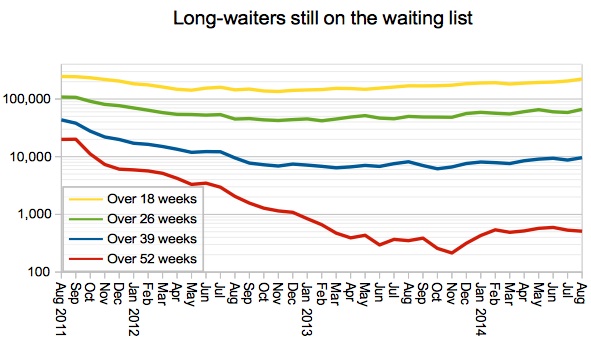
Long-waiters on the waiting list
As the waiting list climbs towards 3.3 million, so the ‘incomplete pathways’ performance climbs towards the 18 week failure level.
To put this performance in context: the incomplete pathways target was publicly announced in November 2011, and first achieved in January 2012 as the NHS focused more on treating long-waiters than it had before. This latest performance is the worst since February 2012, and shows that even the continued focus on treating long-waiting patients is being overwhelmed by the growing waiting list.
If the trend since April were to continue, the 92 per cent incomplete pathways target would breach 18 weeks in October or November.

92pc of waiting list within
The deteriorating position on long waits is seen in all specialties across the board.
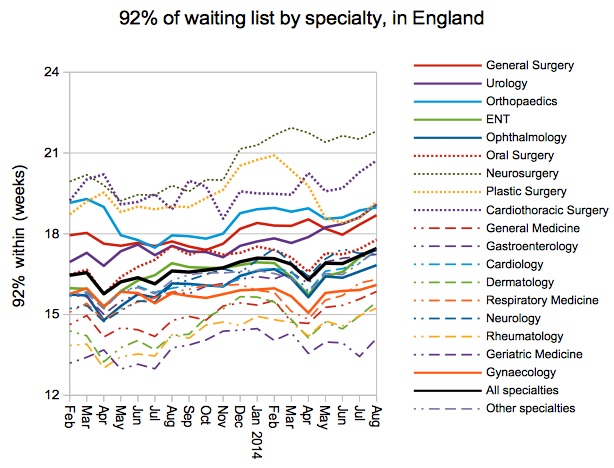
92pc of waiting list by specialty
The incomplete pathways target is meant to be achieved in every specialty in every Trust. The proportion actually achieving the target is now the lowest since March 2012.

Provider-specialties achieving 92pc target
In a well-targeted waiting list initiative you would expect those services with the longest waits (at Trust specialty level) to improve the most. Actually their waiting times went up. Waiting times went up in short-waiting services too.
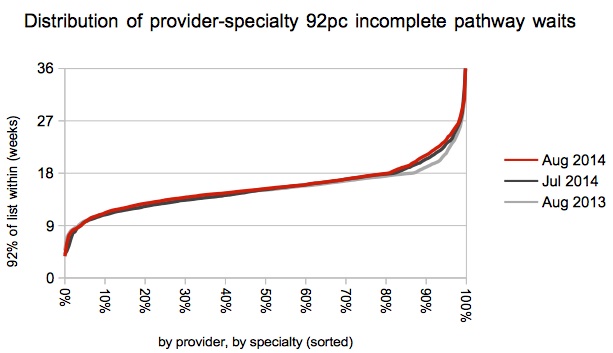
Distribution of 92pc incomplete waits
Local detail
There are interactive maps showing the all-specialties position at every Trust and CCG. For specialty-level analysis at a particular Trust, independent sector provider or CCG, visit our 18-weeks reports page.
There is also a map showing where apparently perverse waiting list management has been detected according to the following test: the adjusted admitted and non-admitted targets were both achieved during the month, even though the incomplete pathways target was breached at both the start and end of the month.
There was not much movement in the “top twenty” table this month, and although Walsall have jumped in at number one it is good to see them reporting their data again after a huge effort to resolve IT problems.
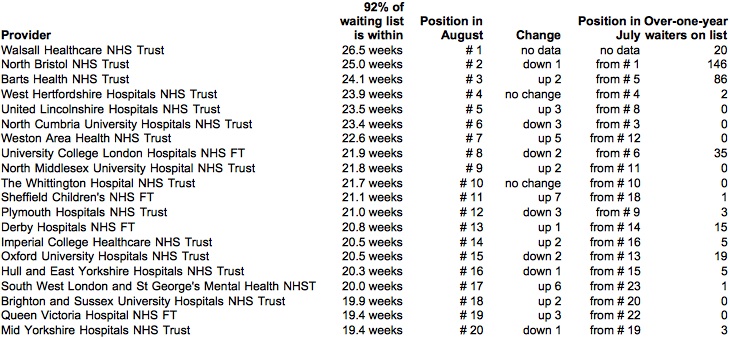
Top twenty
Congratulations to Basildon for dropping out of the table in spectacular style; they were number two last month and have dropped off to 33rd place with 92 per cent of their waiting list now within 18.0 weeks. Well done also to Great Western, and Cumbria Partnership, who dropped out of the table with significant improvements in their long-wait positions.
Data for September 2014 is due out at 9:30am on Thursday 6 November 2014.