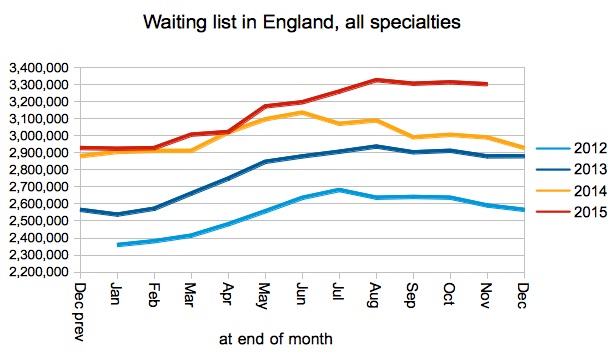
The English NHS plunged deeper into breach territory against the 18 week waiting times target in July, posting the longest waits since the “incomplete pathways” target was announced in November 2011.
This is significant because July marked the start of the new financial incentives to recover 18 weeks against locally agreed “trajectories”. However waiting times continued to deteriorate without those incentives having any visible effect on national performance.
Waiting times are growing because the waiting list is growing. And the waiting list is growing because the NHS is not keeping up with elective demand. Until that changes, I cannot see any prospect of the 18 week target being achieved again – the NHS cannot firefight its way out of this chronic shortfall in activity.
In the following analysis, all figures come from NHS England. If you have a national statistic that you’d like to check up on, you can download our waiting times fact checker.
England-wide picture
Performance against the 18 week waiting time target continued to deteriorate. At the end of July, 92 per cent of the English waiting list extended up to 18.8 weeks, comfortably breaching the 18 week target and the longest since October 2011 (before this relatively new waiting list based target was even announced).
Can you see the improvement, as Trusts made a final push to achieve the start of their RTT recovery trajectories for the end of July? No, neither can I. We’ll unpack that failure in a moment.
The list of non-reporting Trusts is the same as at the end of June. Adding in their last known positions, the waiting list is nearly 3.9 million patients. Whether it tips over 4 million this year depends mainly on whether the junior doctor strikes go ahead.
Returning to the officially reported figures (excluding non-reporting Trusts), the waiting list continues to be much larger this year than last. This is the main reason why waiting times are going up: a longer queue means longer waits.
Admissions per working day were the same as in recent years, which is clearly not enough to keep up with demand.
Long waits were up too, although these figures omit large numbers of long-waiting patients at non-reporting Trusts.
Gynaecology and Ophthalmology remained within the 18 week target, but most other surgical specialties edged further into breach.
Looking now at local hospital services (by specialty, by Trust) only 71.9 per cent of local services were achieving the 18 week target at the end of July, which is a new low since this target has been in force.
The distribution of local waiting times shows deterioration right across the spectrum, with a clear gap against last year’s performance. And here we can return to the story about the recovery trajectories that Trusts are supposed to be achieving from the end of July onwards.
The starting trajectories that Trusts agreed for the end of July fell broadly into three camps:
- Trusts with short waiting times tended to cut themselves a bit of slack, and start their trajectories somewhere between their already-good performance and the 92 per cent target.
- Trusts with long waiting times also went for starting trajectories somewhere between their current performance and 92 per cent, but because their waiting times were already long this meant an ambitious start to their trajectories.
- Trusts with very long waiting times tended to opt for trajectories that cautiously improved their performance back in the general direction of 92 per cent.
On that basis, you might expect the left hand end of the distribution to go up in July, and the right hand end to go down. But that is not what happened. Waiting times got worse, particularly at the longer-waiting end of the spectrum.
Local detail
We’ve done some interactive maps showing the waiting times position by specialty for every Trust and CCG with significant waiting lists. If you want to look your own Trust up quickly, then visit our 18-weeks reports page.
There was little change in the “top twenty” in July, which is consistent with the disappointing start to the RTT recovery trajectories.
Although a couple of Trusts did drop out of the table, they had waiting times comfortably longer than 18 weeks so there is little to cheer there either.
Data for August 2016 is due out at 9:30am on 13th October 2016.


