

The growing English waiting list has finally scored its first casualty, as new data reveals the “90 per cent admitted” target was breached at national level in February. Although the growing waiting list is bad news, it is actually rather good news that this is the target that fell first. Let me explain.
There are three 18-week waiting times targets in England. The newest and best target is that 92 per cent of the waiting list (“incomplete pathways” in the jargon) must be within 18 weeks. This target deters hospitals from building up backlogs of long-waiting patients.
Then there are the older targets, which say that 90 per cent of admitted patients (and 95 per cent of outpatients) must have waited less than 18 weeks. Or, to put it another way: no matter how many long-waiters a hospital has, it is only allowed to devote 10 per cent of its inpatient & daycase capacity (or 5 per cent of its outpatient capacity) to treating those long-waiters; the other 90 per cent (or 95 per cent) of its capacity must be devoted to patients who haven’t waited as long and are therefore jumping the queue. These targets are perverse, because they stop hospitals from doing the right thing by whole-heartedly treating all their longest-waiting patients as soon as they can.
Unfortunately the 90 per cent admitted target happens to be the toughest of the three, so the perverse incentives kick in first. If you allow a well-managed waiting list to grow, eventually the ‘snout’ of the waiting list will pass the 18-week mark. When that happens, the proportion of patients being admitted within 18 weeks flips from wonderful (everyone is admitted within 18 weeks) to terrible (only the urgent patients are). But the proportion of the waiting list itself that extends beyond 18 weeks is still very small, and the list has to grow a fair bit more before it will fail the waiting-list-based target. (The third target, the 95 per cent outpatient (“non-admitted”) target, is not such a problem overall, because many specialties have an outpatient stage before the admitted patient stage, which means that most outpatients are seen quickly anyway to find out what’s wrong with them.)
Back in the days of “targets and terror”, when the waiting-list-based target did not exist, most hospitals would have responded to the pressures by carefully admitting 9 short-waiters for every 1 long-waiter and meeting the admitted patient target that way. That meant, from a patient’s point of view, that once you’d already waited 18 weeks your hospital had no incentive to treat you.
Thankfully it seems those days are now firmly behind us. How can we tell?
Firstly, we have the newer waiting-list-based target, and it has the highest contract penalties to deter hospitals from building up backlogs of long-waiting patients.
Secondly, now that the waiting list has grown too large, hospitals have done the right thing in real life and breached the admitted patient target first, in order to focus as much capacity as possible on treating the longest-waiting patients.
Thirdly, the top of the office is encouraging this. The HSJ reports Dr Barbara Hakin, chief operating officer, NHS England as saying: “This means treating those who have waited the longest, which may mean that we miss the standard. We are determined to redouble our efforts so that we do meet the standard and 90 per cent of patients are treated within 18 weeks. But this may take several months as it is imperative we focus on those who have waited longest.” Hear, hear.
And so to the detail. In the following analysis, all figures come from NHS England. If you have a national statistic that you’d like to check up on, you can download our NHS waiting times fact checker
England-wide picture
The incomplete pathways data is all over the shop this month, because the number of Trusts who failed to report data has doubled in February to six. They are: Barnet and Chase Farm Hospitals NHS Trust; Barking, Havering and Redbridge University Hospitals NHS Trust; Derby Hospitals NHS Foundation Trust (new); Tameside Hospital NHS Foundation Trust (new); The Whittington Hospital NHS Trust; and Ipswich Hospital NHS Trust (new).
Between then, their last reported waiting list sizes come to a total of 126,703, or some 4 per cent of the national waiting list. (In fact, if you add that to the officially-reported list size it now comes to more than 3 million, but let’s get the official figure ‘clean’ when it passes that level… which will probably happen in the March figures now.)
So the apparent drop in February’s waiting list is illusory, because of all the Trusts who did not report their list sizes. Here’s the chart:
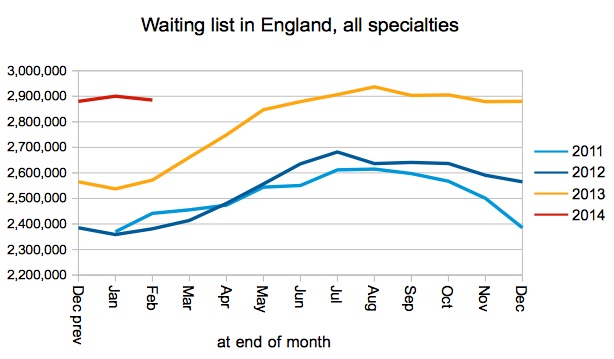
Waiting list in England
Admissions remained slightly higher than in recent years, which is good, but the oversized waiting list shows that this isn’t enough.
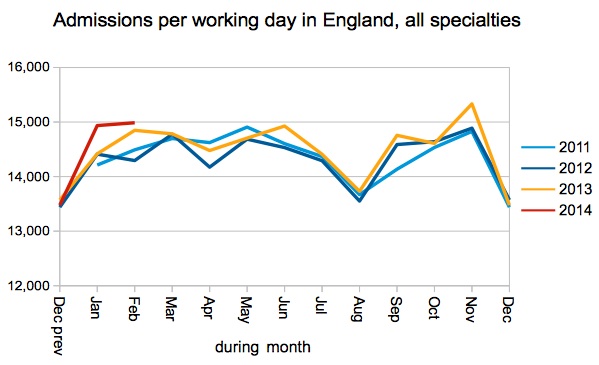
Admissions per working day
With so many Trusts missing from the data, it is hard to put too much faith in the long-waits chart. That’s a nasty rise, but the reality is probably a lot worse.
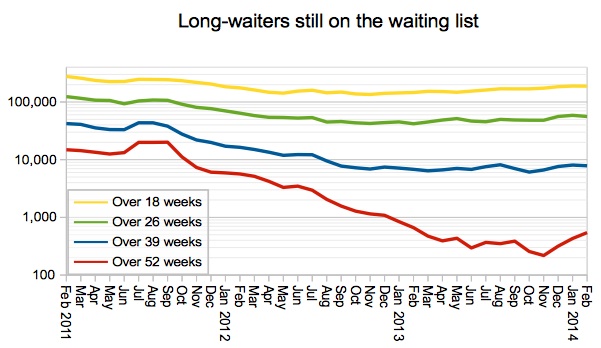
Long-waiters on the waiting list
The NHS rightly responded to the rising numbers of long-waiting patients by trying to admit them, even if that meant breaching the 90 per cent admitted patient target. Excellent. That has helped to hold down the number of long-waiters who are still on the waiting list, which is much more important.
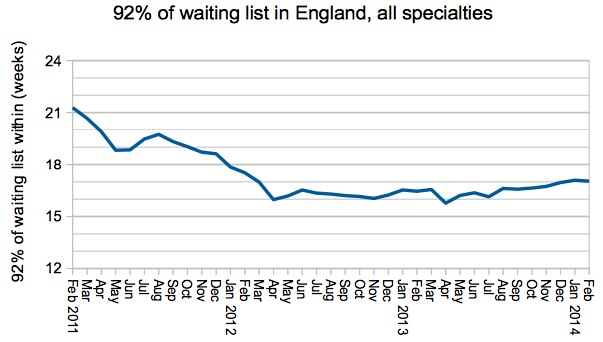
92pc of waiting list was within
The specialty-level picture is similar to last month’s, and Urology has edged a little closer to breaching.
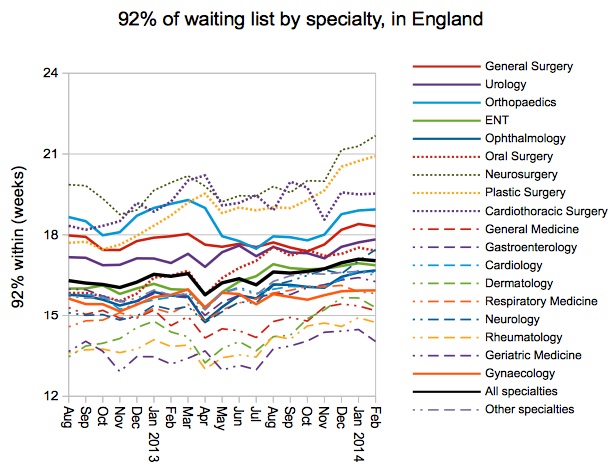
92pc of waiting list by specialty
The proportion of services (specialties within providers) who achieved the waiting-list-based target has been falling, but this levelled off a little in February.
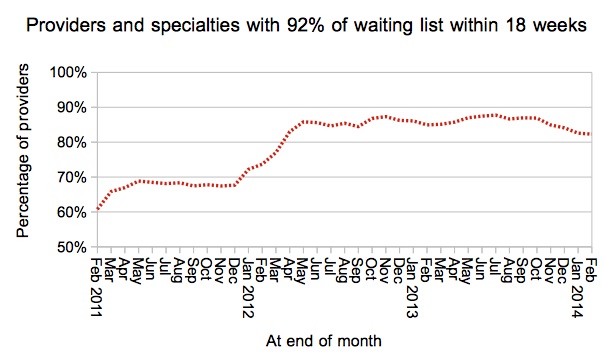
Provider-specialties within 18 weeks
The next chart shows the distribution across every provider-specialty (excluding those with very small waiting lists). The point where the line crosses 18 weeks is the value shows in the time-trend above. The grey lines below show that the distribution has become slightly more extreme, with the longest-waits getting longer and the shortest-waits getting shorter.
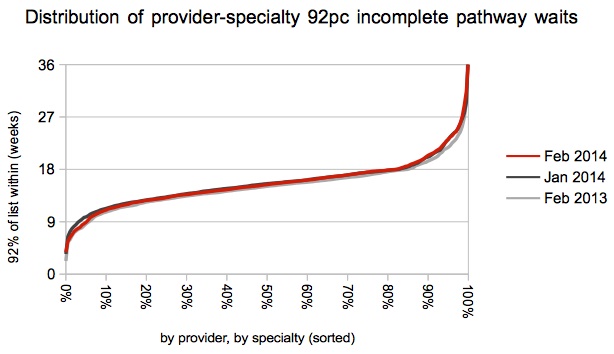
Distribution of provider-specialty 92pc waits
Provider top twenty
There’s a bit of churn at the top of this month’s table, but (with some 6 Trusts failing to report) perhaps I should have started the numbering at 7.
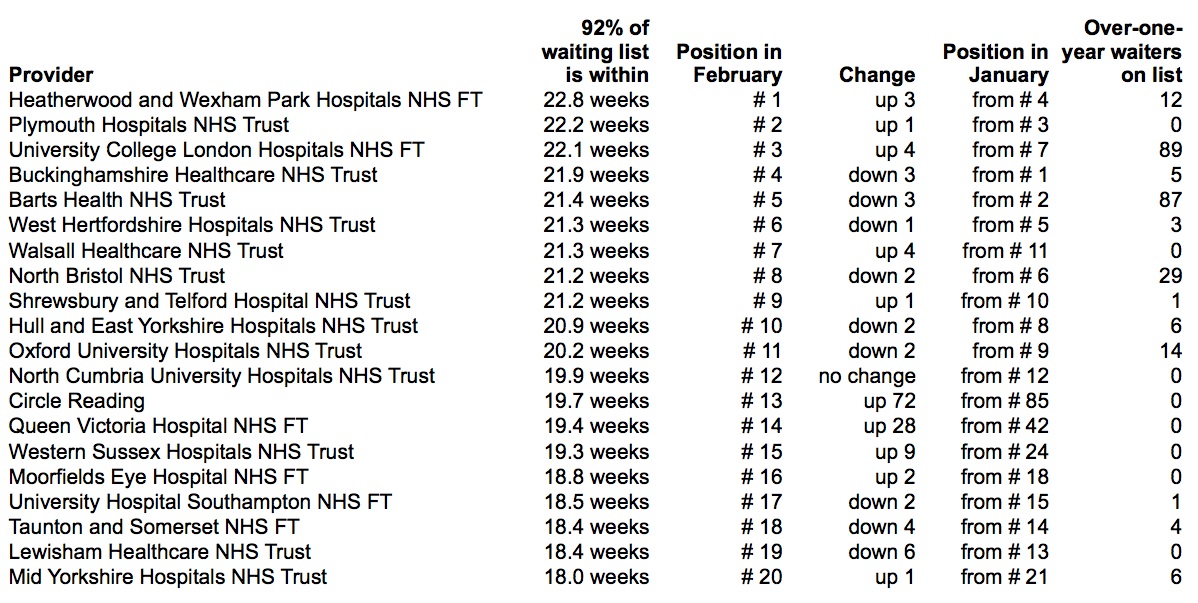
Top Twenty
Congratulations to King’s College Hospital (falling from 16th to 27th place), North West London Hospitals (17th to 23rd place) and Central Manchester (19th to 25th place), for dropping out of the table and achieving the waiting-list-based target in February.
The March 2014 data, which is expected to show the English waiting list topping 3 million, is due out at 9:30am on Thursday 22 May 2014.