
England probably breached the 18 week referral to treatment waiting time target in October, according to figures just released by NHS England.
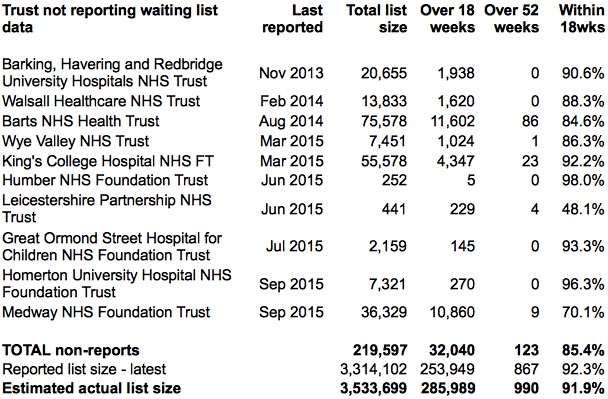
Why ‘probably’? The target was achieved according to the official figures, with 92.3 per cent the waiting list within 18 weeks (against a target of 92 per cent). But if you add in the last known positions at the growing number of non-reporting trusts, only 91.9 per cent of waiting patients were within 18 weeks, meaning that the target was probably missed.
This national-level breach was expected, although admittedly it has happened sooner than I thought it would. Waiting times are a function of two things: the size of the queue, and the order in which patients are treated. The queue has been growing for years because activity has not been keeping up with demand. Patient scheduling improved in early 2012 when the incomplete pathways target was introduced, but at national level there has been no further improvement to offset the pressure caused by the growing waiting list.
So if anyone asks you why 18 weeks has been breached, the main answer is that the waiting list has been growing, and a longer queue means longer waits.
In the following analysis, all figures come from NHS England. If you have a national statistic that you’d like to check up on, you can download our Gooroo NHS waiting times fact checker.
England-wide picture
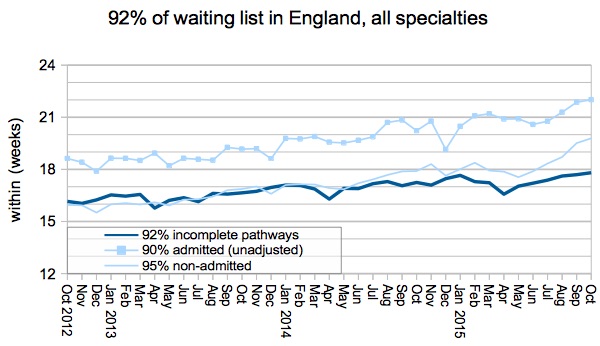
According to the official figures (without adding the non-reporting Trusts back in) the following chart shows the target being narrowly met, with the NHS treating large numbers of long-waiters in an effort to hold waiting times down.
However the headline figures do not tell the whole story. The official Statistical Press Notice also provides an estimated waiting list for which the last reported positions at each missing Trust have been factored back in. Using the same method, we get the following result for English waiting times, which shows the 92 per cent target being narrowly missed at national level.
All the following charts do not, however, adjust for these non-reporting Trusts. It’s just too fiddly. So here are the reported figures.
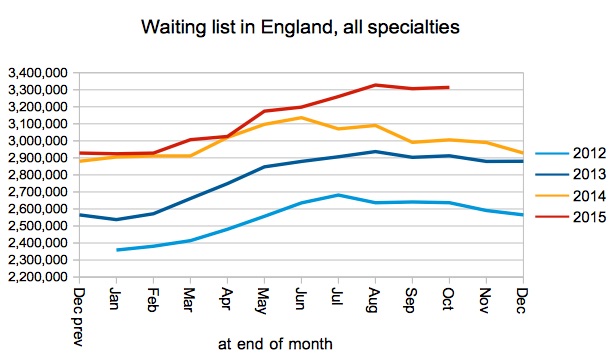
The number of patients on the waiting list usually falls in the autumn, but this year it is so far remaining steady (as it did in 2013). This is bad news, because it means that the waiting list is growing year on year.
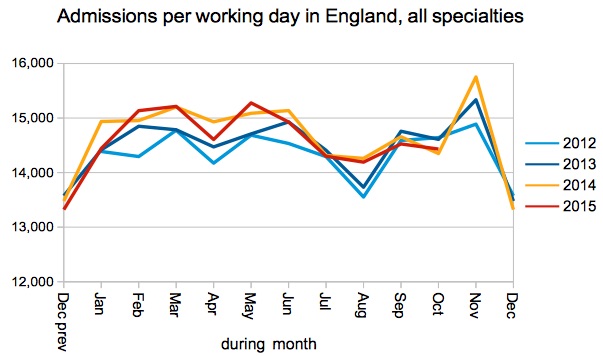
Admissions per working day were flat on last year, and below the two previous years. This is plainly not enough: demand has been rising and activity needs to rise too if the growing waiting list is to be arrested.
The number of one-year waiters has been rising, although these figures are much more sensitive to non-reporting Trusts and therefore cannot be relied upon. But clearly this is not what Jeremy Hunt had in mind when he declared last year that “I want this number of people waiting more than a year for their operation to be not in the thousands, not in the hundreds, but as close to zero as possible”.

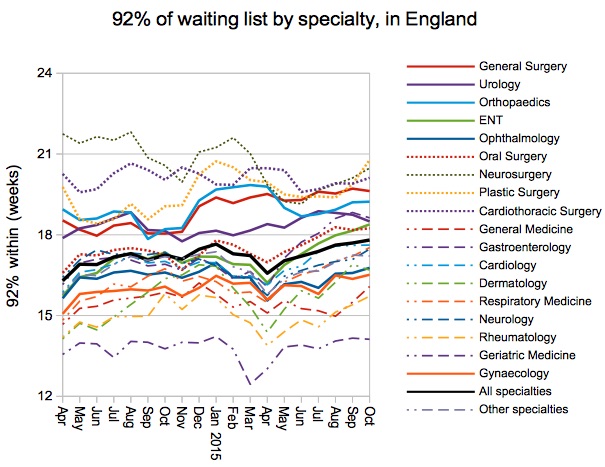
At specialty level the position is similar to last month, with only ophthalmology and gynaecology achieving 18 weeks among the high-volume surgical specialties.
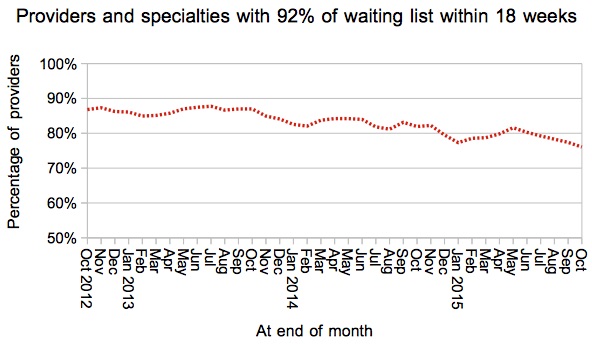
The proportion of local services (specialties at Trust level) achieving 18 weeks fell again to 76 per cent, in line with the overall gloomy picture.
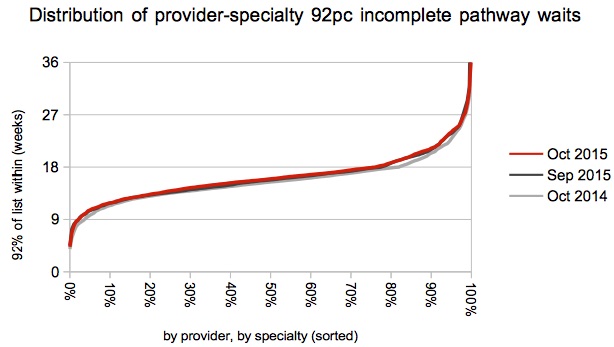
The deterioration in waiting times was quite evenly spread across the spectrum.
Local detail
We’ve done some interactive maps showing the waiting times position by specialty for every Trust and CCG with significant numbers of admissions. If you want to look your own Trust up quickly, then visit our 18-weeks reports page.
The Princess Alexandra Hospital NHS Trust started reporting their waiting times data again, which is very welcome. It is often the case that Trusts who start reporting again have lots of long waiters on their lists, so it is perhaps not surprising to see them going straight in at the top of the table.
Which is exactly what happened to Medway NHS Foundation Trust when they resumed reporting a few months ago. Unfortunately they have now dropped back out of the data series again, having previously topped the table at 30.8 weeks in the September data.
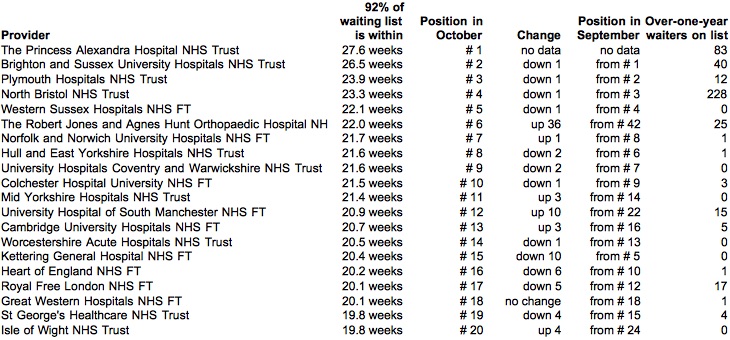
Just one Trust managed to drop out of the table and also achieve 18 weeks: well done East Kent Hospitals University NHS Foundation Trust, who have gone from 19th place to 45th.
Data for November is due out at 9:30am on 14 January 2016. Have a good Christmas, but I’m afraid that on the RTT front it is unlikely to be a particularly happy New Year.
