The NHS doesn’t have enough beds. Emergency demand has kept on rising, and it’s filling up the beds and squeezing out elective work. It’s like winter now, all year round. Elective demand has risen too, but there is no way of keeping up with it. We need more capacity, and that’s all there is to it.
So I keep hearing. And no doubt there is plenty of truth in this narrative. But it doesn’t explain what happens in August.
Every year, elective admissions dip in August. And this year, according to the latest figures, the number of patients admitted from RTT pathways per working day was the lowest since 2013.
Why does this keep happening? Yes, I know, the long summer holidays.
But if beds are the bottleneck, then why do we let so many staff go on holiday at once? It leaves precious beds lying empty, when they could be used to clear back a stubbornly rising waiting list.
Perhaps the familiar narrative should be more nuanced: beds are usually the bottleneck, except when the schools are on holiday. But it’s an uncomfortable nuance – annual leave can be managed, so this is a problem that we have by choice.
This is the other side of seasonal planning, and it’s just as important for RTT waiting times as planning for winter. It is one example of why demand and capacity planning should be a continuous operationally-led process, not an annual financially-led one.
Anyway, on to the data for August. As usual, in the following analysis, all figures come from NHS England. If you have a national statistic that you’d like to check up on, you can download our 18 week waiting times fact checker.
England-wide picture
Waiting times edged up to 18.9 weeks, breaching the 18 weeks incomplete pathways target again, in defiance of the nationally-agreed trajectories which are meant to be bringing them down.
Waiting times for those patients selected for treatment (the admitted and non-admitted measures) rose as the NHS rightly focused attention on long waiters.
The list of non-reporting Trusts was the same as in July. After adjusting for those Trusts’ last known positions, only 90.5 per of the waiting list was inside 18 weeks and the waiting list was approaching 4 million patients.
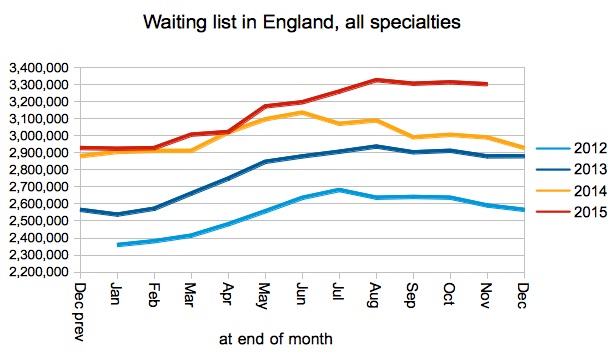
The waiting list is much bigger than last year, which is why waiting times are going up. Looking at the chart, the gap narrowed slightly in August compared with July, but you need to go back to last year for the reason: 2015 saw the largest ever August increase in the waiting list and this year was more typical.
The national waiting list usually peaks in July or August, so we can expect it to shrink for the rest of the year. In good years it shrinks quite a bit in the autumn, and in bad years it hardly shrinks at all – we shall see.
Admissions per working day were a tie with August 2013 and much lower than in the last two years. Although beds are probably the main overall bottleneck in most hospitals, this isn’t true at all times of year and the chart below suggests that staff are probably the bottleneck at peak holiday seasons.
Long waiters remain on an upward trend, and there are plenty more one year waiters at non-reporting Trusts.
Ophthalmology tipped over 18 weeks in August, leaving Gynaecology as the only surgical specialty that is still meeting the target at national level. But probably not for much longer – at the end of August, Gynaecology stood at 92 per cent within 17.999 weeks with was only 3 patients away from an England-wide breach.
The proportion of local services (specialties within Trusts) achieving the 18 week target fell sharply from 71.9 to 70.1 per cent in August. Unfortunately this trend is likely to accelerate, as we shall see next.
Waiting times crept up across the board, and the central part of the distribution curve has now reached the 18 week level. As the curve continues to rise, we can now expect the proportion of services achieving 18 weeks to fall rapidly.
Local detail
We’ve done some interactive maps showing the waiting times position by specialty for every Trust and CCG with significant waiting lists. If you want to look your own Trust up quickly, then visit our 18-weeks reports page.
The top twenty list is little changed from July.
Data for September 2016 is due out at 9:30am on 10th November.


