

A shrinking waiting list, and greater attention to treating long-waiting patients, brought waiting times back inside 20 weeks during January. But waiting lists would need to shrink all the way back to last year’s level to make the national 18 week standard sustainable again.
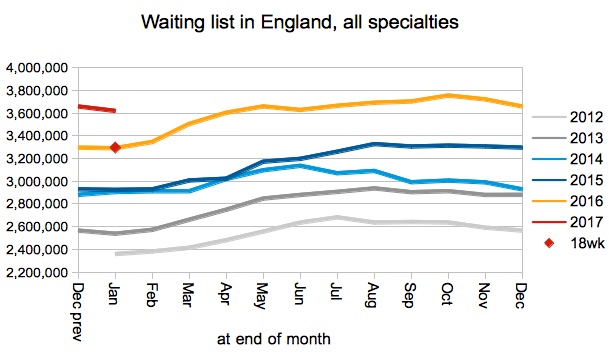
It is not unusual for the waiting list to get smaller at this time of year. The seasonal pattern is for the English waiting list to shrink from about August to January, and then grow again in the spring.
But in recent years, rapid year-on-year growth has virtually wiped out this seasonal shrinkage. So its reappearance this year is welcome, and the latest fall of nearly 39,000 patients is the biggest January fall since 2011 – i.e. since before the rapid year-on-year growth began.
Is this a good omen for the future? So far it’s really only a blip. The key thing to watch is the size of the waiting list – if it keeps closing in on last year’s level, then there will be grounds for optimism.
As usual, in the following analysis, all figures come from NHS England. If you have a national statistic that you’d like to check up on, you can download our RTT waiting times fact checker.
England-wide picture
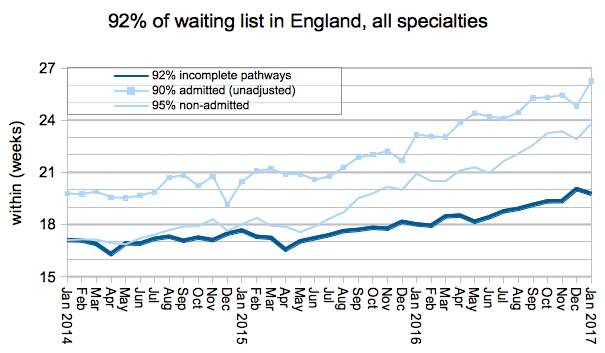
The dark blue line below shows waiting times easing back below 20 weeks, which was not unexpected although it happened earlier than I had forecast. But on recent trends this is unlikely to last, and we can expect waiting times to rise permanently above 20 weeks over the summer.
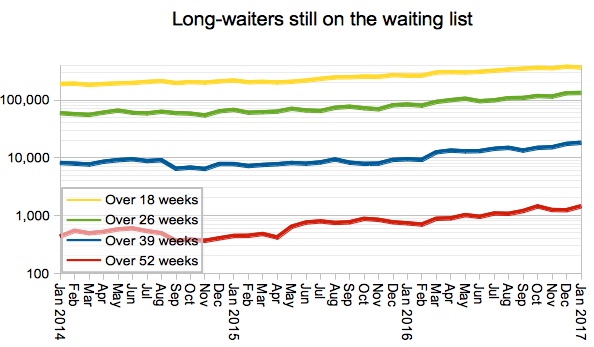
The pale blue lines in the chart below show two things: first that more long-waiting patients were treated (which is welcome), and secondly that those long-waiters had been on the waiting list in the first place (which is not). However the dark blue line shows that those efforts had the desired effect – at the end of January, there were fewer long waiters still on the waiting list than before.
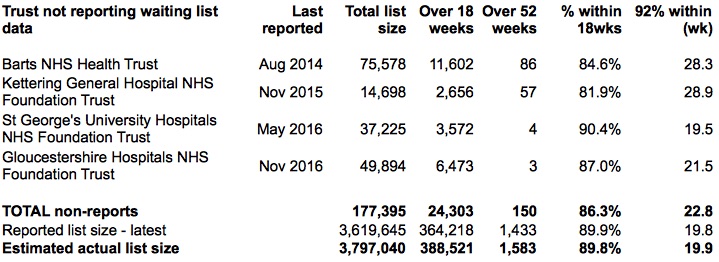
It is good to see Great Ormond Street Hospital for Children NHS Foundation Trust submitting waiting list data again, for the first time since July 2015, and they have now disappeared from the table below. Which means that only four trusts are not reporting data.
Turning back to the reported figures, we can see that the waiting list shrank noticeably in January. Nevertheless the waiting list size that is consistent with sustaining the 18 week standard is (for the second month running) almost exactly the same as last year’s list size. So there is a lot of work to do if 18 weeks is ever to be achieved again.
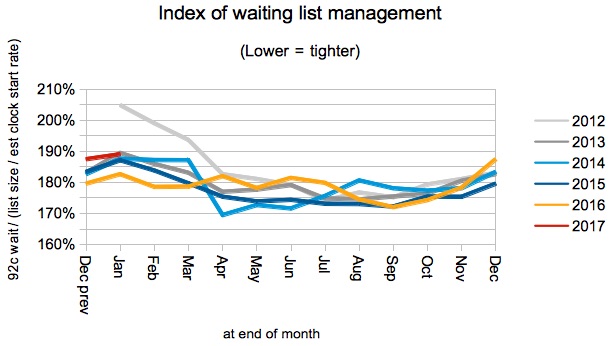
Waiting list management, also referred to as the waiting list shape, remained consistent at national level with the seasonal pattern since the incomplete pathways target was introduced in early 2012.
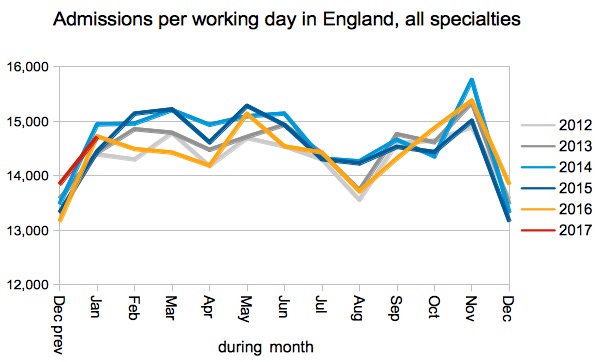
Admissions per working day were consistent with recent years, despite the unusually specific instructions from the centre to reduce elective activity to clear beds for non-elective patients. It is worth bearing in mind that RTT admissions are largely daycase rather than inpatient, and a lot of the inpatient elective work is cancer (which cannot be significantly delayed) and orthopaedics (which often uses protected clean beds). So perhaps we should not be surprised that those instructions had so little impact on overall admissions.
If you turn to the longest-waiting end of the waiting list, however, inpatients probably feature a lot more strongly. And their numbers edged upwards in January.
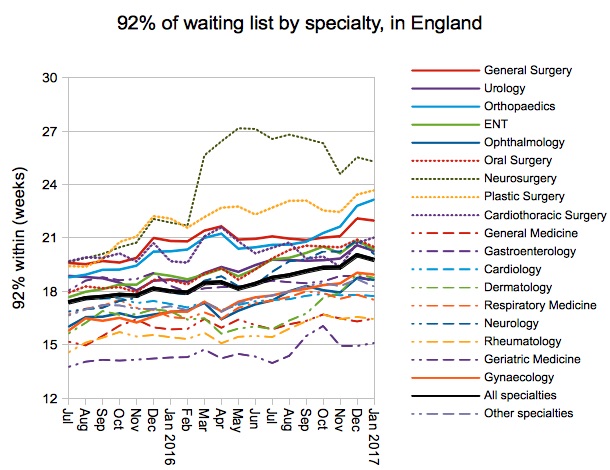
At national specialty level, orthopaedics bucked the trend with lengthening waiting times, while other surgical specialties mostly improved theirs.
It is also worth noting that many medical specialties, which are predominantly outpatient, are breaching 18 weeks nationally. Only general medicine, cardiology, thoracic medicine, rheumatology and geriatric medicine are still achieving the standard.
Local detail
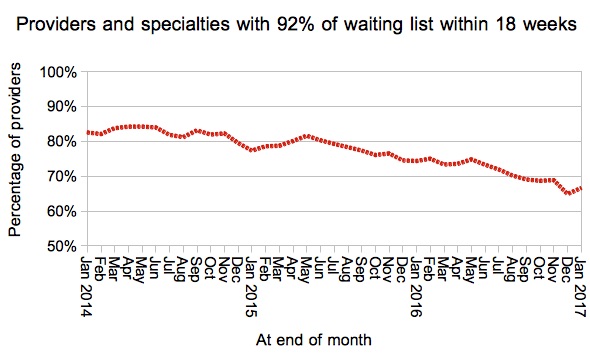
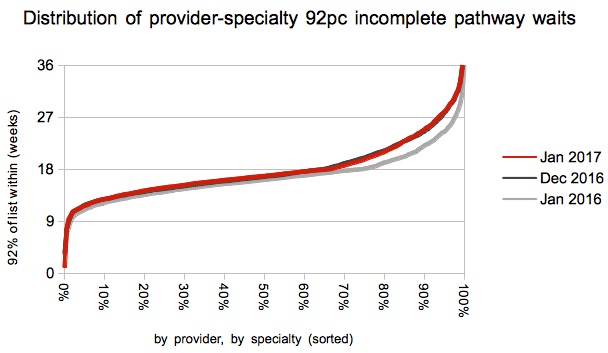
The proportion of local specialties achieving 18 weeks ticked up, which is consistent with the overall picture.
The distribution of local specialty waiting times hardly budged.
We’ve also done some interactive maps showing the waiting times position by specialty for every Trust and CCG with significant waiting lists. If you want to look your own Trust up quickly, then visit our 18-weeks reports page.
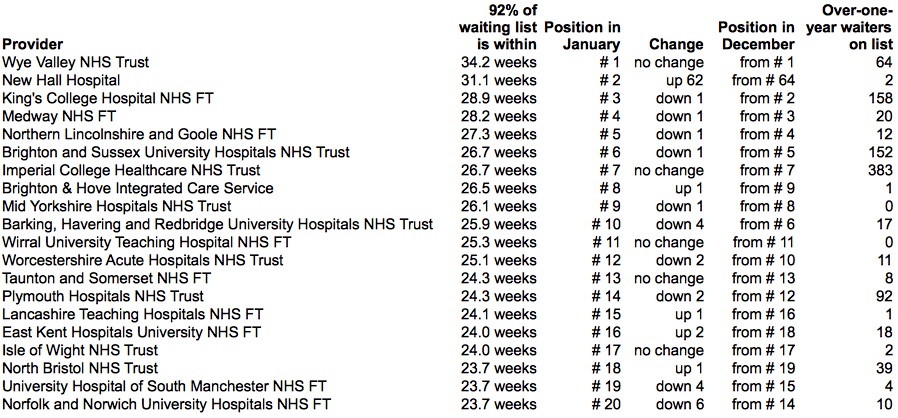
When a trust starts to report its waiting times data again after a ‘reporting break’, it is common for them to jump straight in near the top of the ‘long waits’ table. So it is good to see Great Ormond Street Hospital for Children NHS Foundation Trust slipping in quietly at 72nd place with a 92nd centile waiting time of 18.7 weeks.
You may now be wondering how far down the table you have to go, before you reach a provider that is actually achieving 18 weeks. So I checked: it’s 83rd place.
Data for February 2017 is due out at 9:30am on 13th April (the second Thursday of the month).