

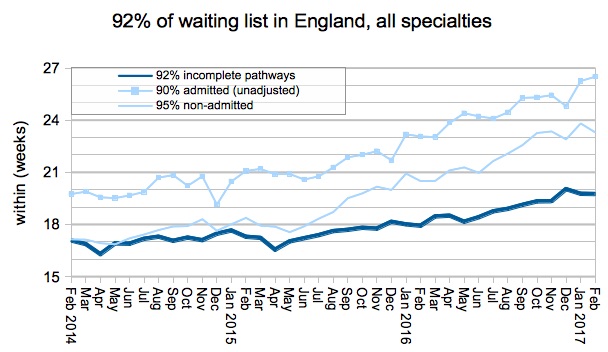
England’s referral-to-treatment (RTT) waiting times held steady at 19.8 weeks in February, locking in January’s slight improvement but still breaching the 18 week standard.
For most trusts, February was the last full month in which they believed they were subject to financial penalties for RTT performance. Those penalties were lifted retroactively in late March, after RTT waiting times were downgraded to “Overall 2020 goals” in the government’s mandate to NHS England.
Does that mean we can expect waiting times to rise after March? Possibly, but it would be unwise for any trust or commissioner to relax.
The main driver of long waiting times is currently the growing waiting list, and as the 2020 general election approaches there is likely to be a renewed focus on RTT waiting times. So any growth in the waiting list now will have to be unwound again in a couple of years (probably as a waiting list initiative at high marginal cost). Letting the list grow might seem an easy option, but in reality it is only storing up much greater pain for the future.
As usual, in the following analysis, all figures come from NHS England. If you have a national statistic that you’d like to check up on, you can download our RTT waiting times fact checker.
England-wide picture
Waiting times remained just below 20 weeks in February, maintaining January’s slight improvement.
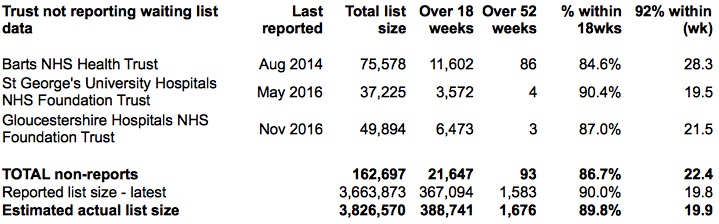
Kettering General Hospital NHS Foundation Trust started reporting RTT data again for the first time since November 2015 – well done them. That leaves only 3 non-reporting trusts – the smallest number since early 2014 when the rash of non-reporting really got underway.
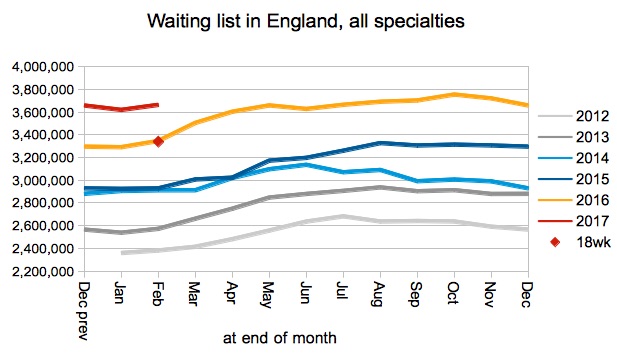
Returning to the published figures, the waiting list continues to be much larger than it was last year, and it would have to return to around last year’s size before the 18 week standard became sustainable again.
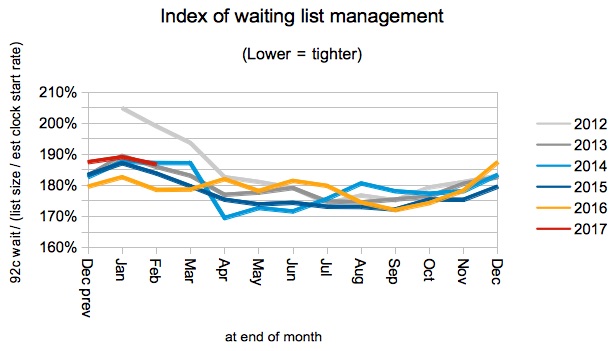
The national index of waiting list management continues to follow the seasonal pattern that was established when the incomplete pathways target was introduced in 2012. This is why the size of waiting list is currently the main driver of waiting times performance.
But I would also expect this index to be quite sensitive to the level of importance attached to RTT waiting times. If the lifting of financial penalties in March leads to a loss of focus, then a rise in this index might be the first clear sign.
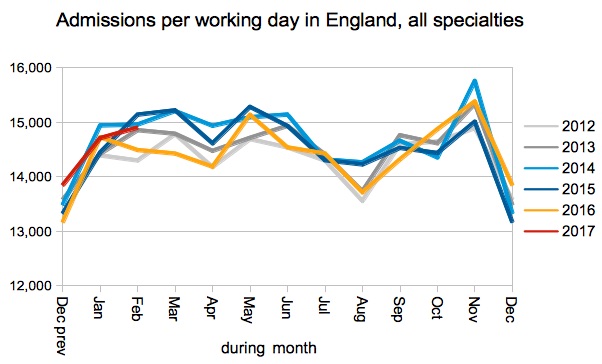
Admissions per working day continued the post-Christmas recovery, in line with recent years.
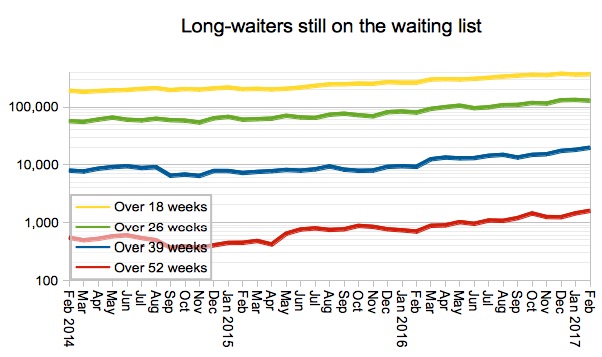
The number of very long waiters continued to creep up. This measure is important, because very long waits for the few have a much larger impact than small increases for the many. This is also a measure that could slip quite quickly if the NHS starts paying less attention to RTT waiting times.
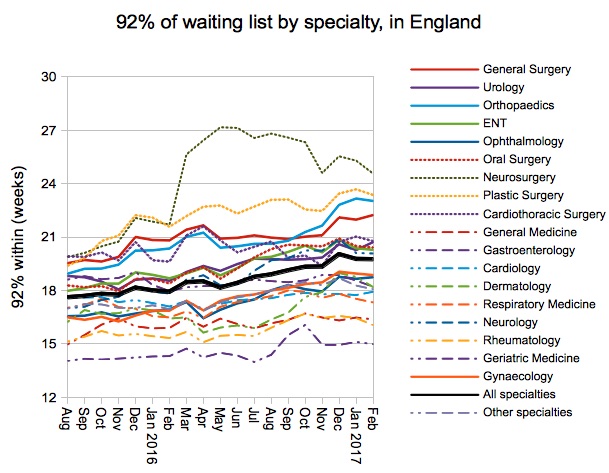
At specialty level there were winners and losers, within the stable overall position for the month.
Local detail
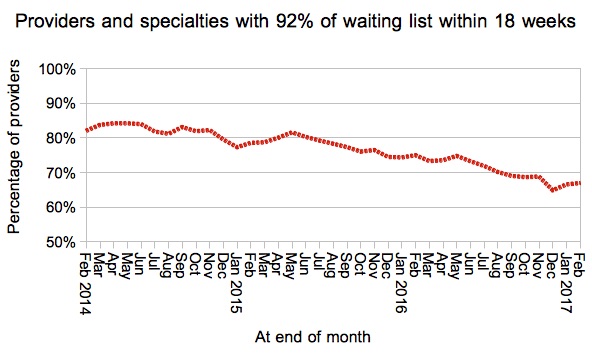
Consistent with the overall stability, the proportion of local specialties achieving 18 weeks remained steady…
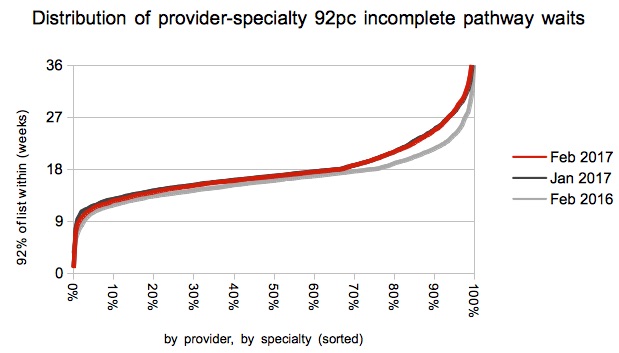
…as did the distribution of waiting times across local services. Looking at the comparison with last year, it is striking how waiting times unzip when they start to breach 18 weeks.
We’ve also done some interactive maps showing the waiting times position by specialty for every Trust and CCG with significant waiting lists. If you want to look your own Trust up quickly, then visit our 18-weeks reports page.
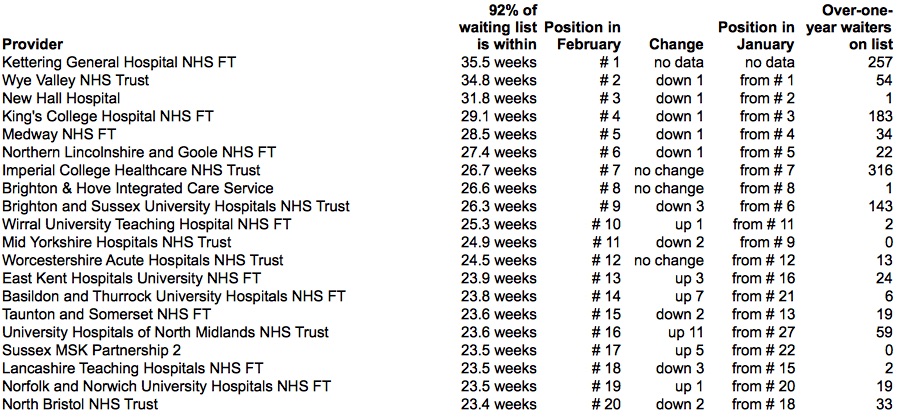
Kettering have jumped straight in at the top of the long waits table on their return to reporting, which is quite common for trusts who have recently suffered severe problems with their data. Otherwise there is little change in the top twenty, apart from the surprise entry of University Hospitals of North Midlands NHS Trust, who I don’t think we have seen in the top twenty since July 2015.
Data for March 2017 is due out at 9:30am on 11th May (the second Thursday of the month).