

But one month does not a recovery make. It is a sign of the times that something not getting worse, just once, is a cause for celebration. But let us take the good news where we can find it. The Prime Minister must be particularly pleased.
Analysis produced for Health Service Journal by Dr Rob Findlay, Director of Strategic Solutions at Insource Ltd and founder of Gooroo Ltd
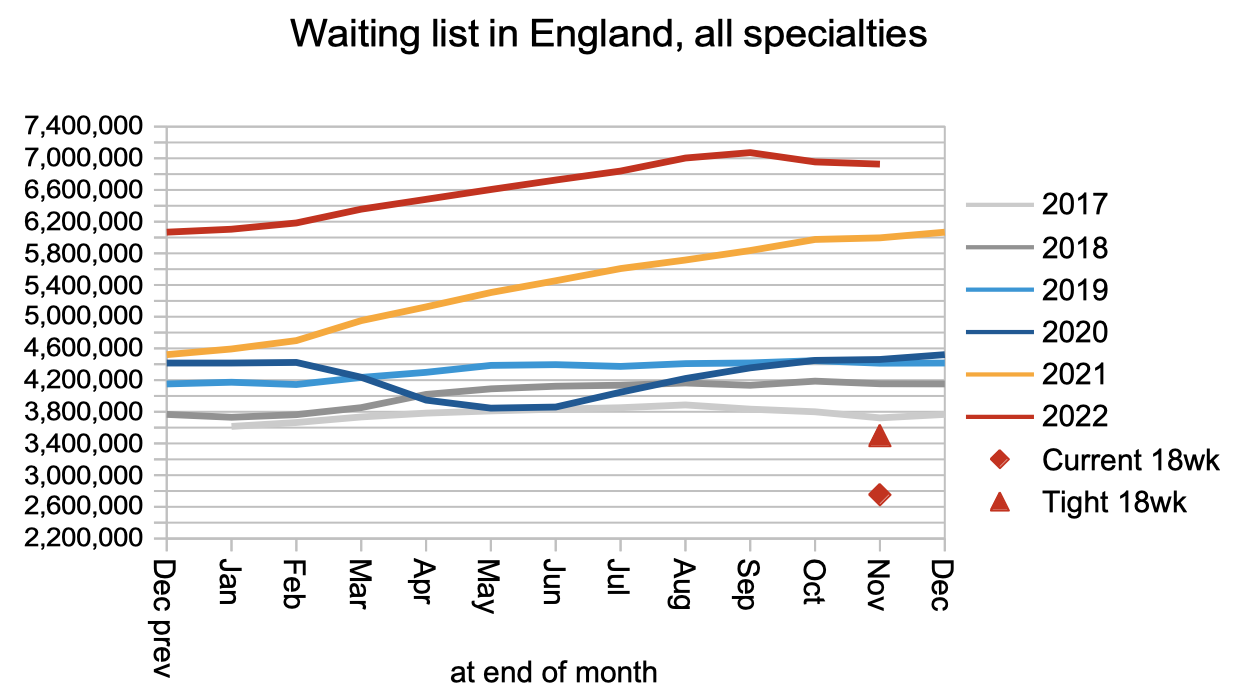
For the first time since May 2020, the English referral-to-treatment (RTT) elective waiting list did not get bigger (taking non-reporting trusts into account). Waiting times fell from 47.0 weeks to 45.8 weeks. And the number of patients waiting longer than both 104 weeks and 78 weeks reportedly reduced (although I should gloomily point out that those figures may not be reliable any more, the targets for them are being missed, and they are poorly designed targets anyway).
November is only one month, and a month with better-than-average prospects of producing hopeful figures: the underlying seasonal pattern – in years when the NHS is keeping up with demand – is for waiting lists to shrink naturally in the autumn and early winter. So let us raise one cheer for November’s elective waits performance, and hold the other two cheers until we see what happens next.
In the following discussion, all figures come from NHS England. If you have a national statistic that you’d like to check up on, you can download our waiting times fact checker. For analysis of waiting times performance at a particular organisation, visit our reports page, or our map of the latest elective waiting times across England.
The numbers
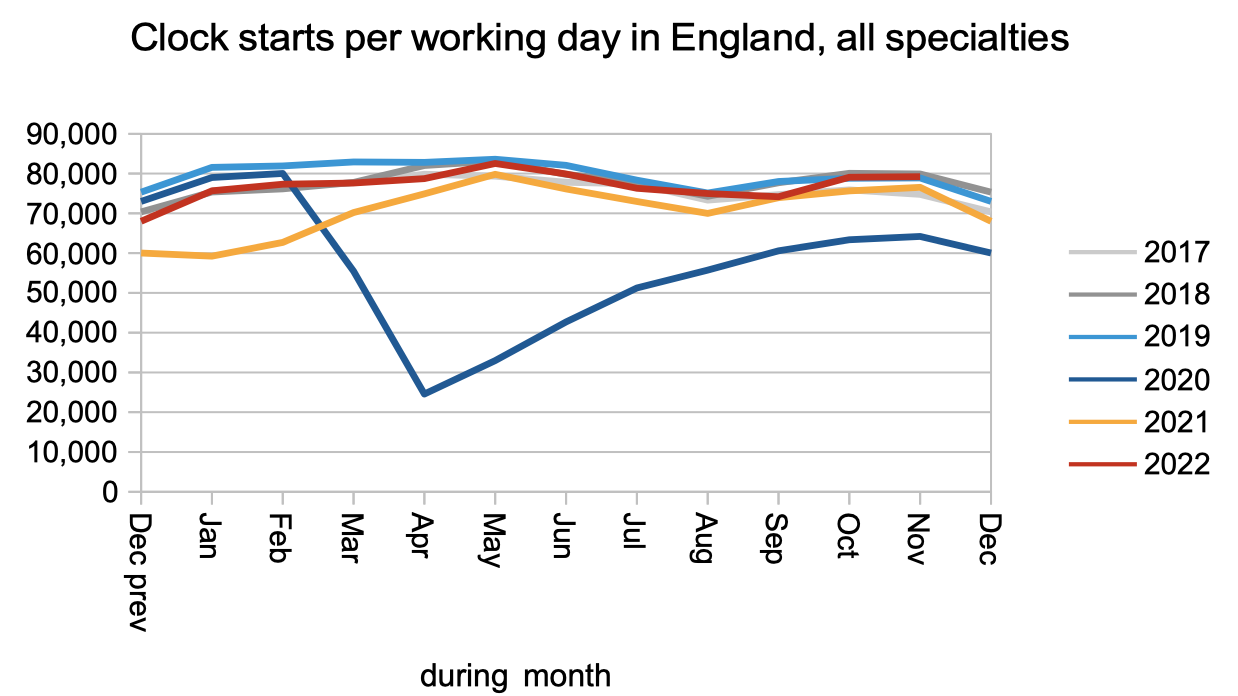
Patients were referred onto the waiting to start new waiting time ‘clocks’ at pre-pandemic rates.
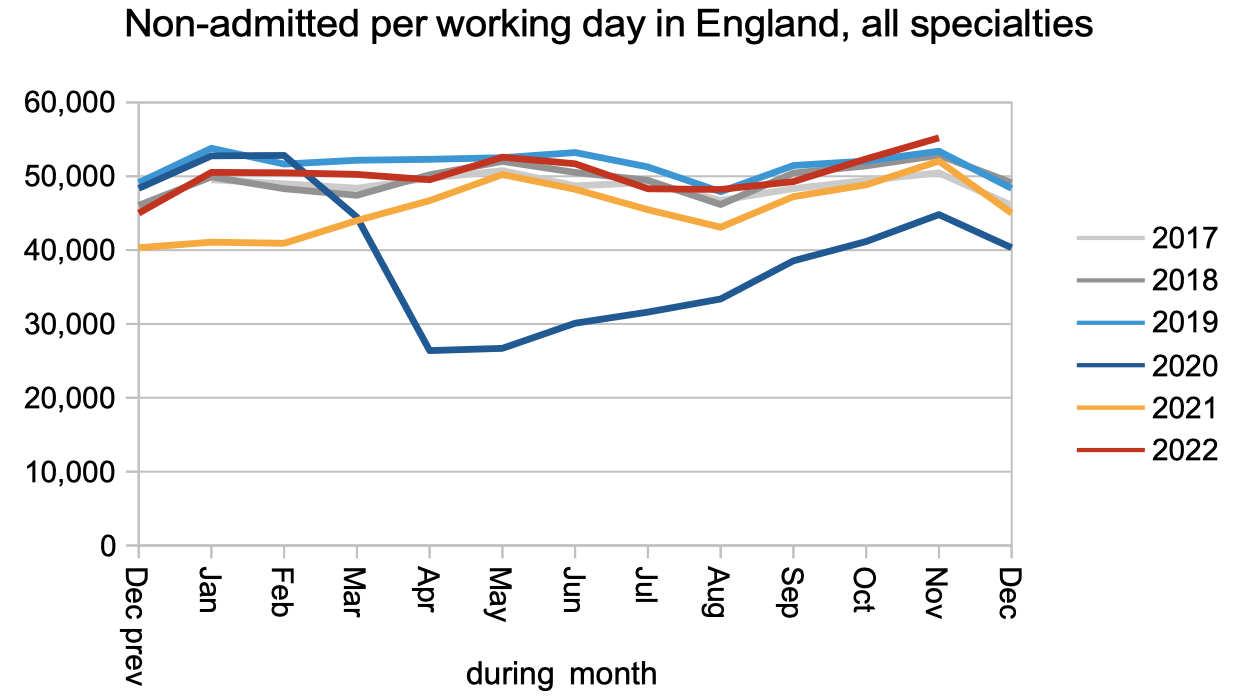
Patients left the waiting list, for reasons other than admission for treatment, at higher than pre-pandemic rates (e.g. after being seen as outpatients, or removed administratively). This is a good thing because it alleviates the wait for diagnosis, and we know there are significant numbers of undiagnosed cancers and other urgent conditions on the ordinary (non-cancer) RTT waiting list.
Patients left the waiting list, following admission, at slightly below pre-pandemic rates.
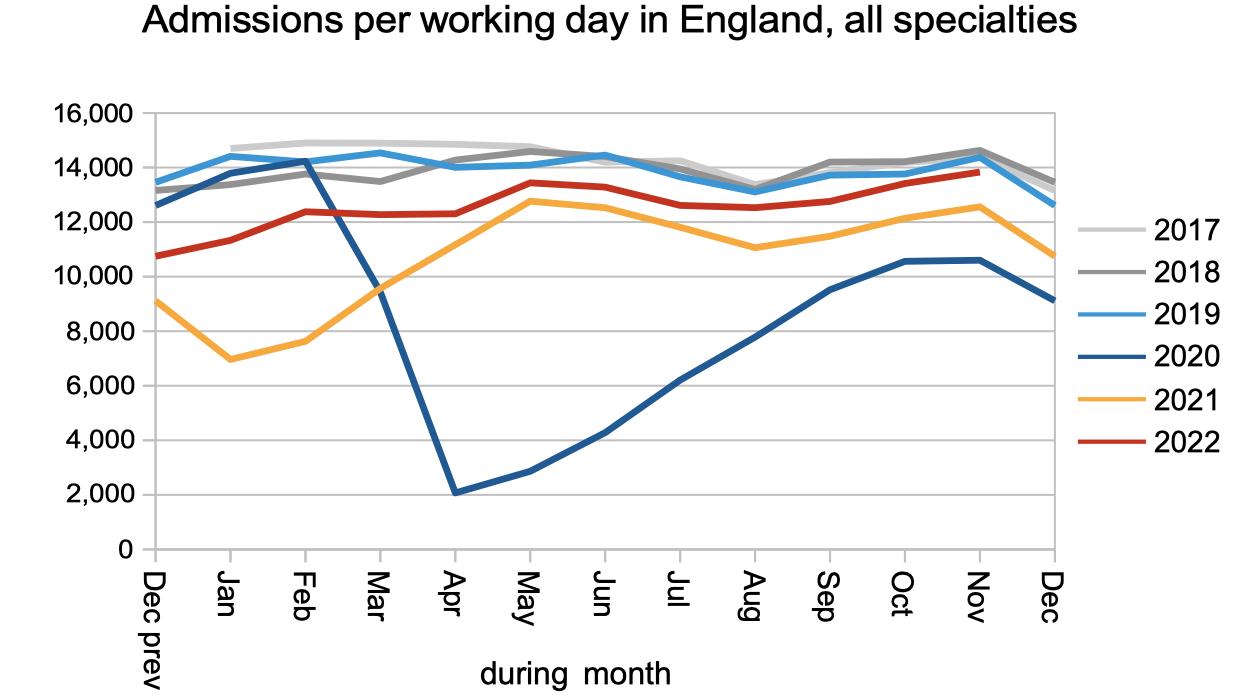
The net result of these pre-pandemic levels of demand, higher non-admitted rates, and only slightly lower than pre-pandemic admitted rates, was a slightly shrinking waiting list. Which is a good thing, and a welcome respite from the rapidly-growing waiting list we have become used to.
(Note that these charts are unadjusted for non-reporting trusts, and the dip in October was caused by Manchester University NHS Foundation Trust dropping out of the data.)
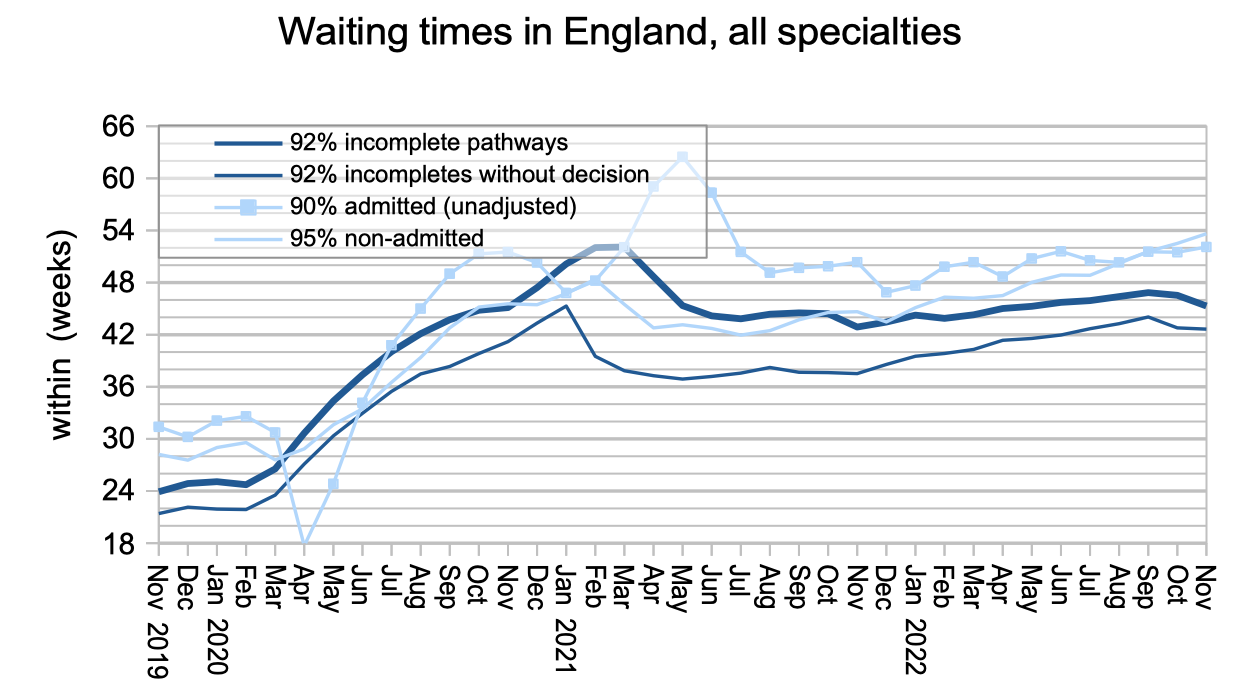
The next chart shows the effect on waiting times, and it is worth looking at this more closely. Again, the October figures are skewed by a very large trust dropping out of the data.
We saw above that the non-admitted rate increased, and the chart below (thin pale line) shows that long waiters were the beneficiaries of that extra activity, and that the waiting time to diagnosis and decision fell slightly as a result (thin dark line).
The picture on admitted patients and overall incomplete pathway waiting times is more complicated, because of the recent guidance that allows trusts to report a more flattering version of their waiting times to the public, and which prodominantly affects patients waiting to be admitted for treatment. So we may need to take the drop in incomplete pathway waiting times with caution.
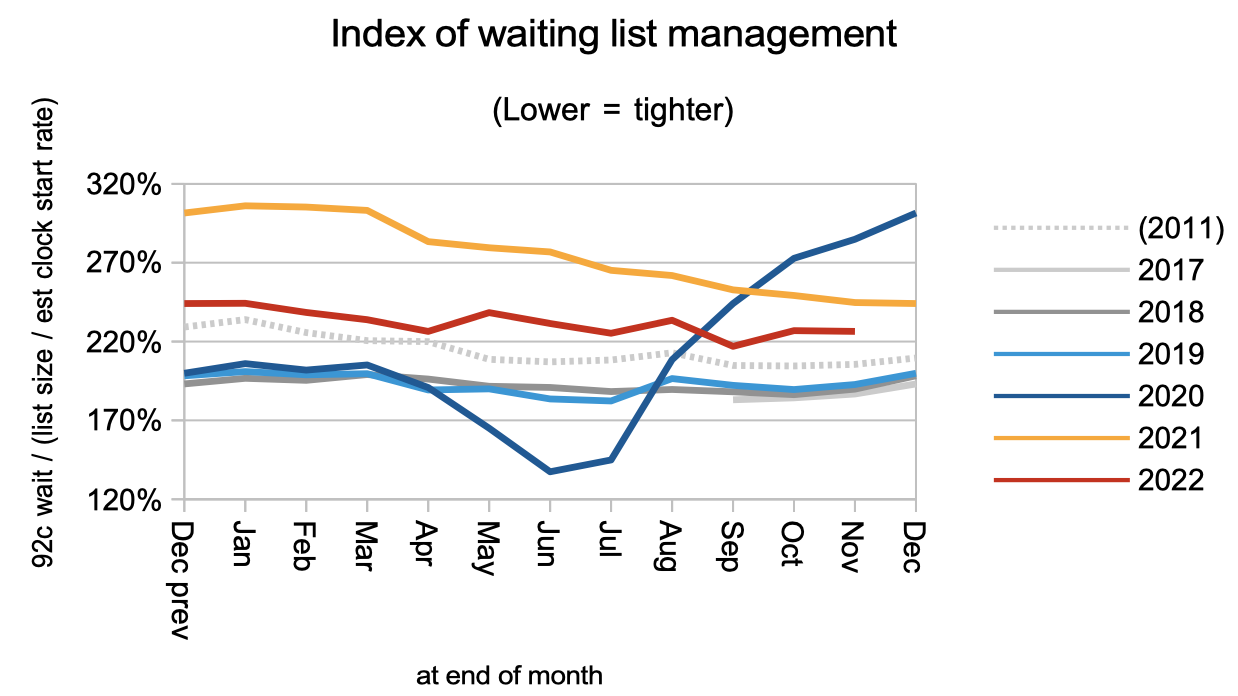
Waiting times are a function of both the size and shape of the waiting list, and the chart below shows that the shape is still significantly worse than pre-pandemic.
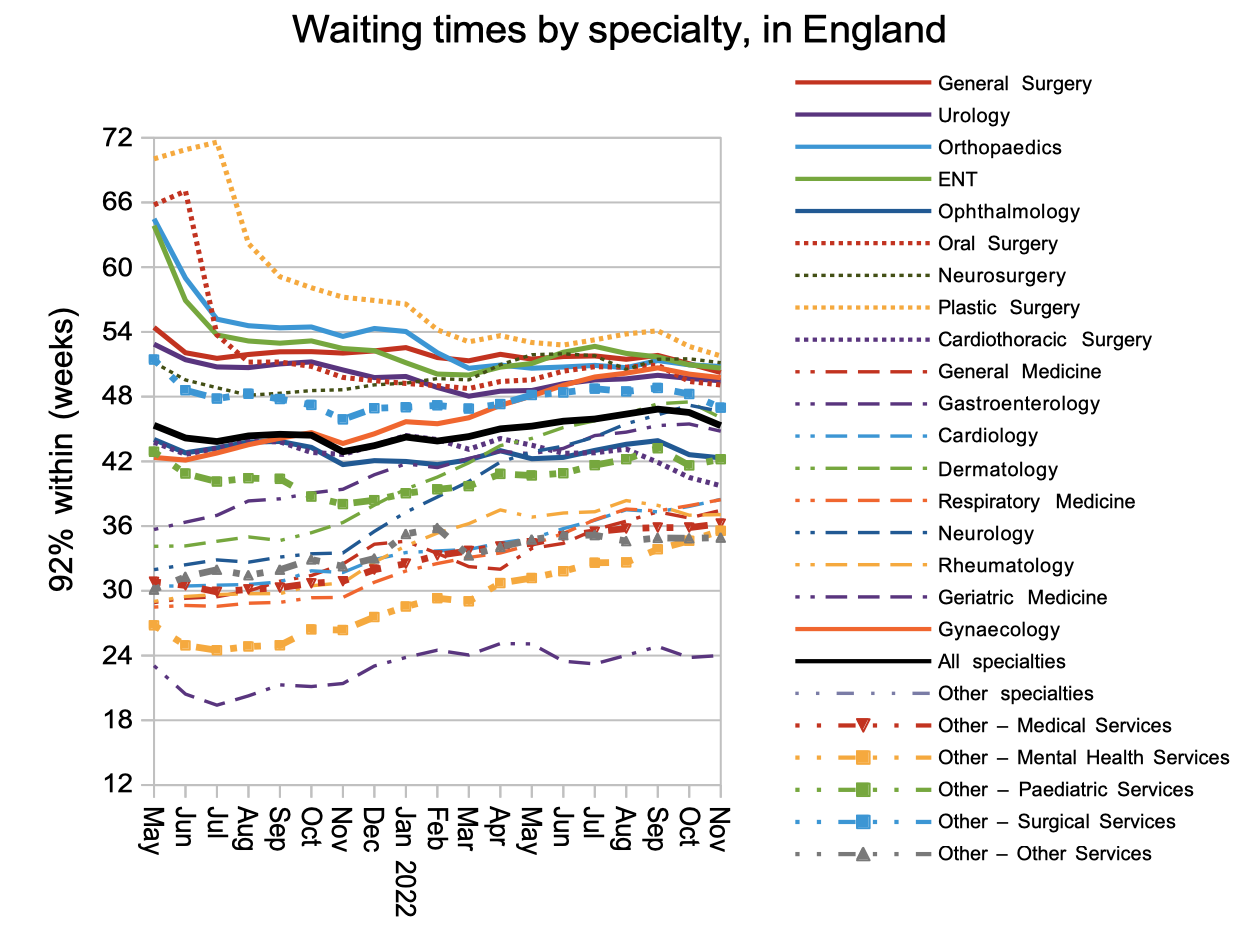
Plastic surgery waiting times fell below one year in November, meaning that all specialties are now within one year at national level.
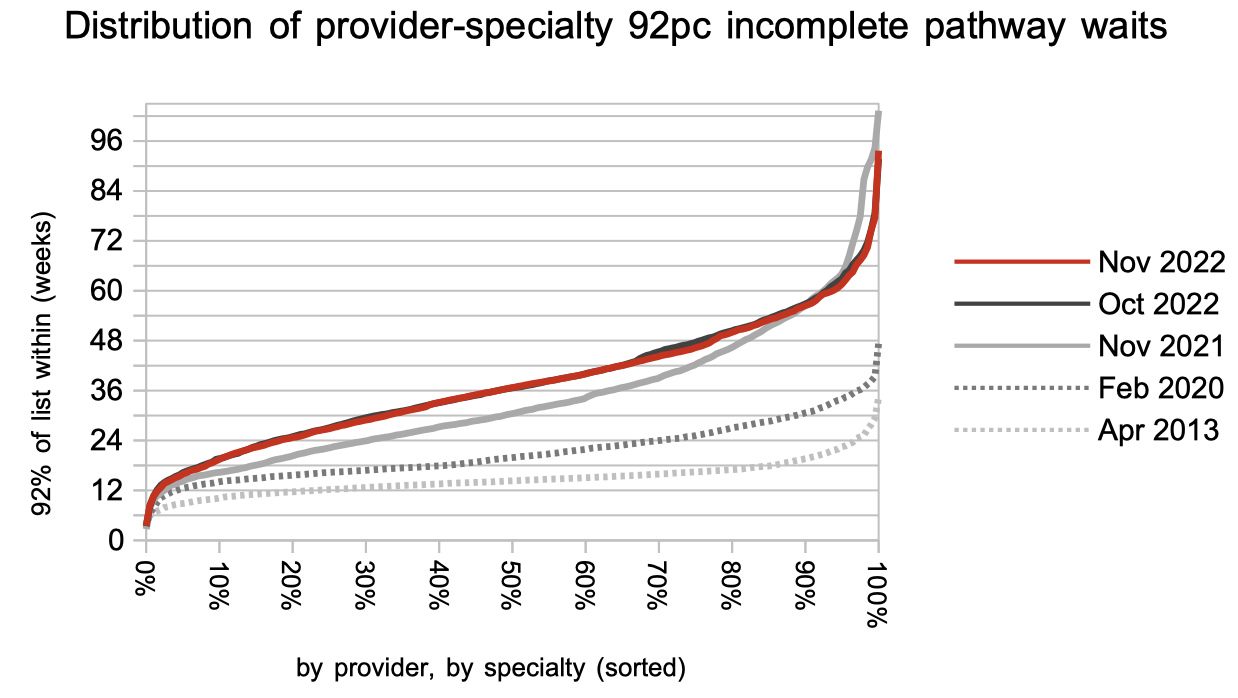
Looking at the 2,500-odd local specialties within trusts, we can see that the improvement in waiting times was mostly at the longer-waiting end of the spectrum, which again is a good thing. Let us not forget to glance at the pre-pandemic and 2013 positions, though, to remind ourselves how much ground we still need to recover.
Referral-to-treatment data up to the end of December 2022 is due out at 9:30am on Thursday 9th February.