Referral to treatment waiting times in the English NHS remained steady in November, according to the latest figures. At the end of the month, 92 per cent of patients on the waiting list had waited less than 19.3 weeks, which is the same performance as October and remains significantly worse than the 18 week standard.
Other measures of performance were unremarkable as well. The size and shape of the waiting list, and admissions per working day, were all typical of the post-2012 seasonal pattern. Unfortunately that post-2012 pattern is also consistent with things getting steadily worse with no end in sight.
As usual, in the following analysis, all figures come from NHS England. If you have a national statistic that you’d like to check up on, you can download our RTT waiting times fact checker.
England-wide picture
Not much changed during the month so let’s canter through the figures fairly quickly.
All three published measures of waiting times were much the same as in October.
Burton Hospitals NHS Foundation Trust started reporting data again – well done them. It is really good to see the list of non-reporting trusts getting shorter at last.
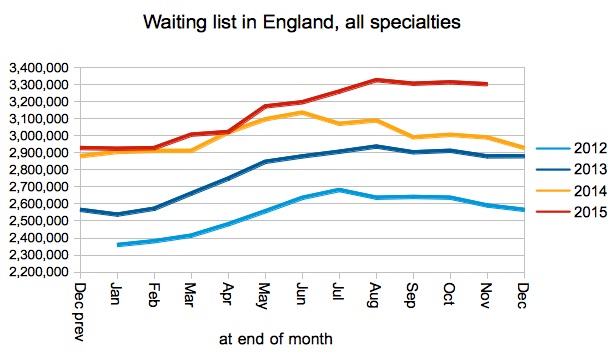
Returning to the reported figures, the next chart makes it look as if the waiting list has grown since the summer, but if you adjust for non-reporting trusts it has more likely shrunk since August in line with the usual post-2012 seasonal profile.
Since 2012, national waiting times have mainly been driven by the size of the waiting list, and the red blob in the chart below estimates how small the list would need to have been at the end of November to achieve the 18 week standard.
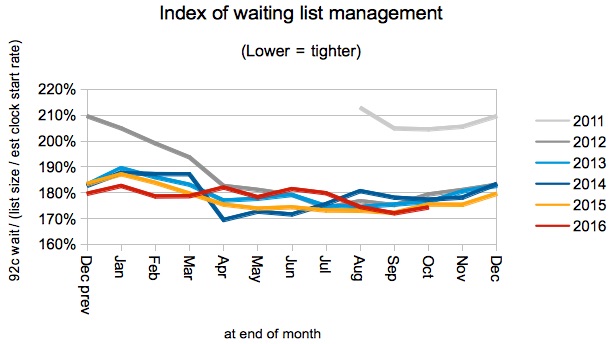
Waiting times are a function of two things: the size of the waiting list, and the order in which patients are treated. The chart above shows the former, and the chart below shows an index of the latter. This index has remained remarkably consistent since 2012 (which is why I said that waiting times are now mainly driven by the size of the waiting list).
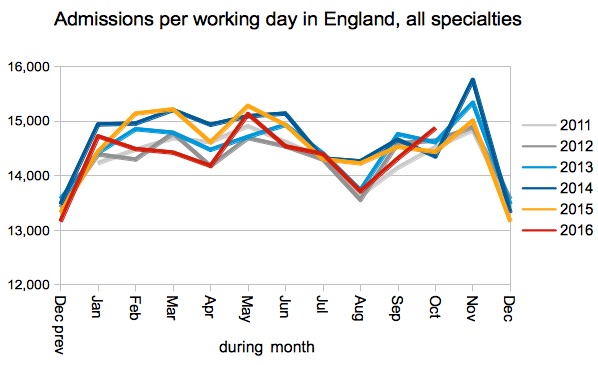
Admissions per working day were very much in line with recent years.
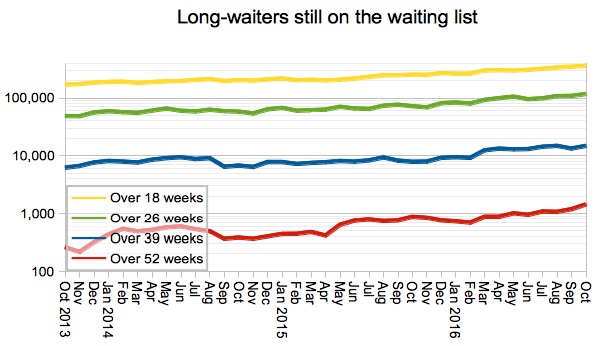
There was a modest reduction in the number of one-year waiters, as several trusts made welcome inroads into their worst backlogs.
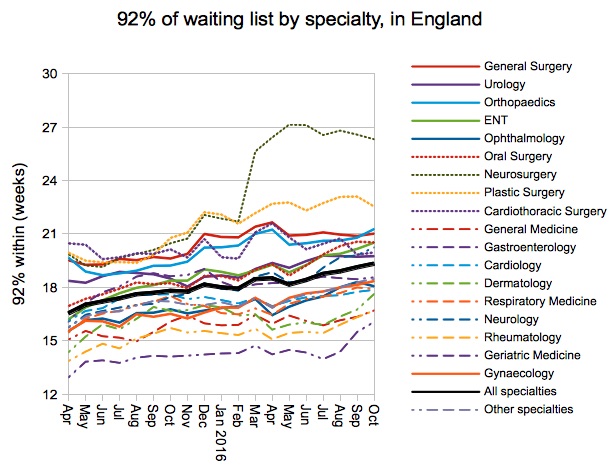
Ophthalmology scraped back inside 18 weeks again, although all other surgical specialties remained in breach.
Consistent with the other figures, the proportion of local services (specialties within trusts) that achieved 18 weeks remained steady in November.
The distribution of waiting times in local services remained broadly steady too, although there was some improvement in the shortest-waiting services.
Local detail
We’ve done some interactive maps showing the waiting times position by specialty for every Trust and CCG with significant waiting lists. If you want to look your own Trust up quickly, then visit our 18-weeks reports page.
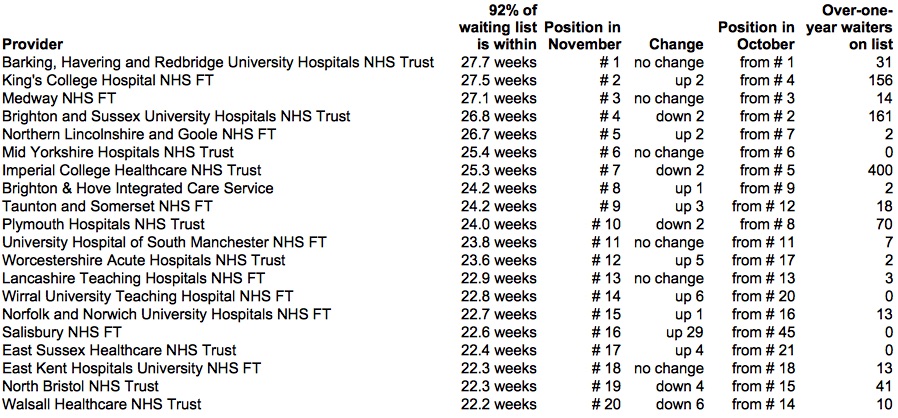
There was a bit of minor reshuffling among the top twenty longest-waiting trusts. There was also one surprise entry, as Salisbury NHS Foundation Trust leapt 29 places with a 2.8 week increase in waiting times; on the other hand, they have just implemented a new IT system which can often lead to difficulties with reported waiting times.
Data for December 2016 is due out at 9:30am on 9th February.


