

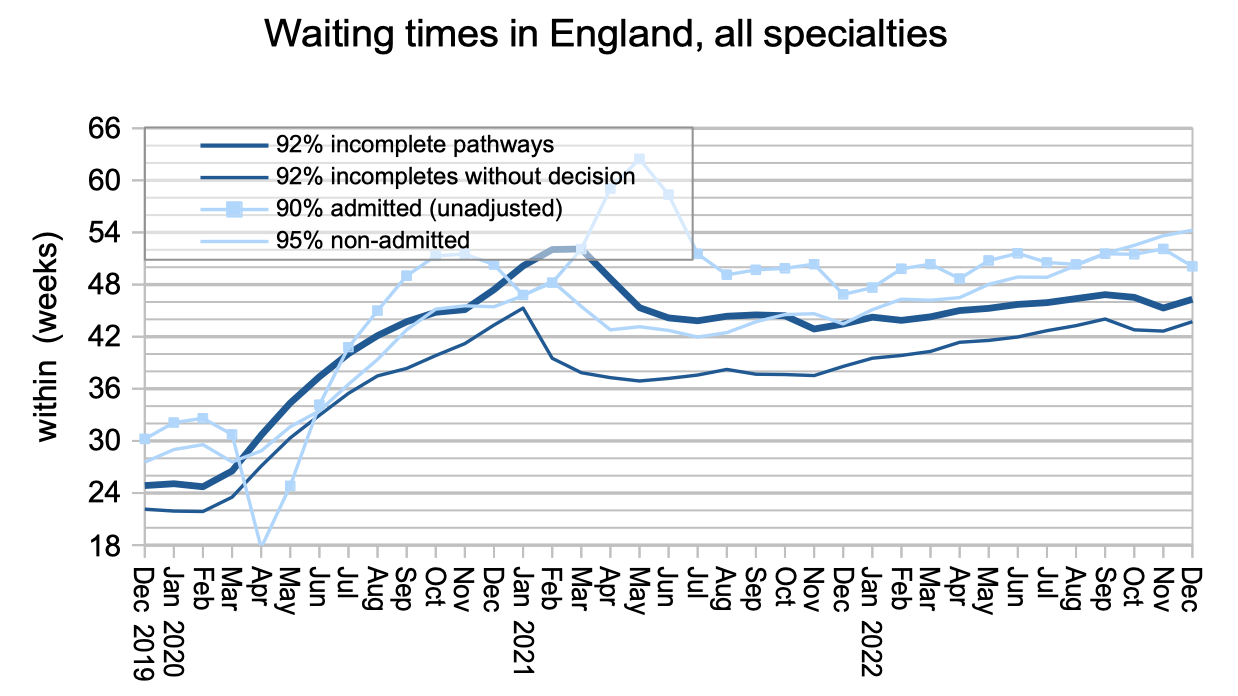
Referral-to-treatment (RTT) waiting times rose by one week in the month of December, to 46.3 weeks (or to 46.7 weeks if estimates for missing data are added back in).
Analysis produced for Health Service Journal by Dr Rob Findlay, Director of Strategic Solutions at Insource Ltd and founder of Gooroo Ltd
More worryingly, waiting times from referral to Decision to Admit, which is the best available measure of the waiting time to diagnosis across England, rose by just over a week to 43.7 weeks (which is over 10 months). This is far too long if your eventual diagnosis turns out to be a previously-unsuspected cancer or other urgent condition, which I estimate will happen to around 25,200 of the patients who are currently waiting. In the interests of clinical safety, it is this long waiting list for diagnosis and decision that should be tackled first.
In the following discussion, all figures come from NHS England. I have decided to discontinue the usual RTT waiting times fact checker because, quite frankly, NHS England’s statisticians are doing a better job of it nowadays. You can find their excellent summary “RTT Overview Timeseries Including Estimates for Missing Trusts” spreadsheet on the current RTT data page.
For analysis of waiting times performance at a particular organisation, visit our reports page, or our map of the latest elective waiting times across England.
The numbers
The latest data is for December 2022, which contains the Christmas and New Year holiday and is usually a relatively quiet month for elective demand and activity. On top of that, Manchester University NHS Foundation Trust stopped reporting RTT data in October which means that all the volume figures below are somewhat lower than their true value.
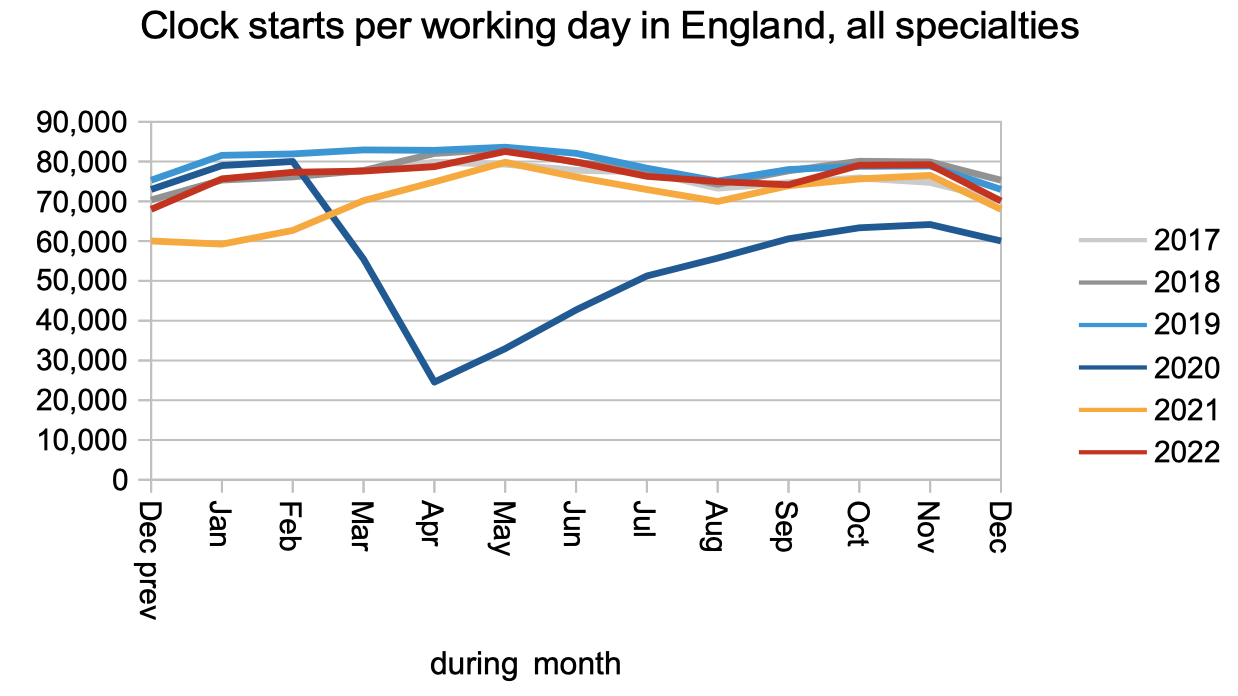
The number of patients starting new waiting time ‘clocks’, which is a measure of elective demand, fell back to slightly below pre-pandemic rates.
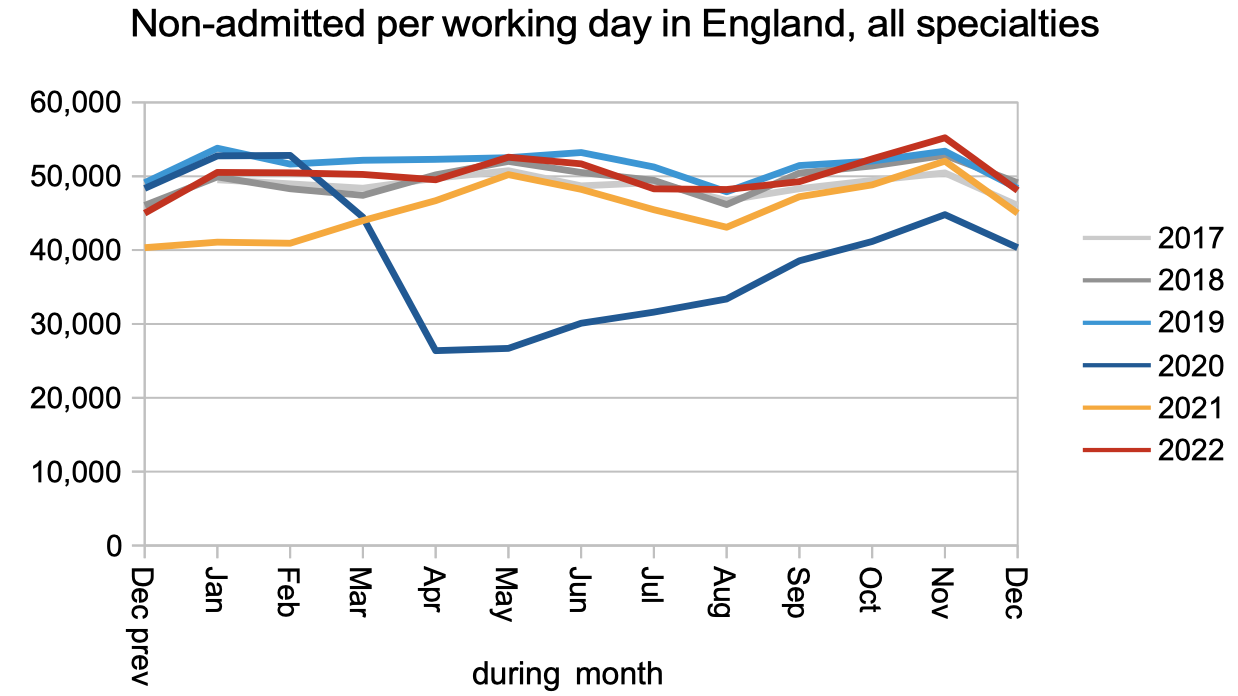
Non-admitted activity, which is mostly patients discharged from clinic, fell back to pre-pandemic rates after rising briefly above that in November.
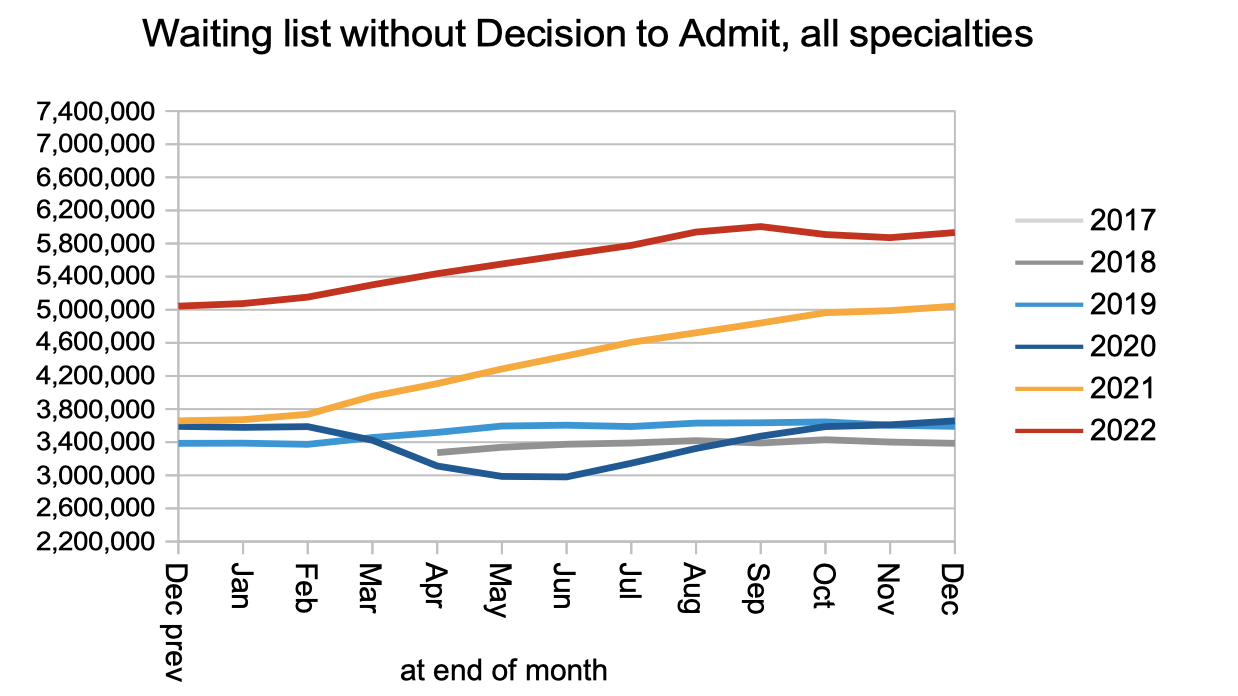
The next chart is new, and shows how many RTT waiting list patients do not have a Decision to Admit. This is the best availably proxy for the number of undiagnosed patients on the English waiting list, which matters because around four in every thousand of them will turn out to have a hitherto unsuspected cancer.
What is striking about this chart is how dramatically the numbers of undiagnosed patients increased during 2021 and 2022. This represents a large increase in the clinical risk on the waiting list, which is why it is so important to reduce the waiting list for diagnosis early. There are other reasons why this would be a good idea: this is where the sheer numbers are, so it would reduce the administrative burden of managing the waiting list, and the outpatient booking process works much better when there is a short wait for a first outpatient appointment.
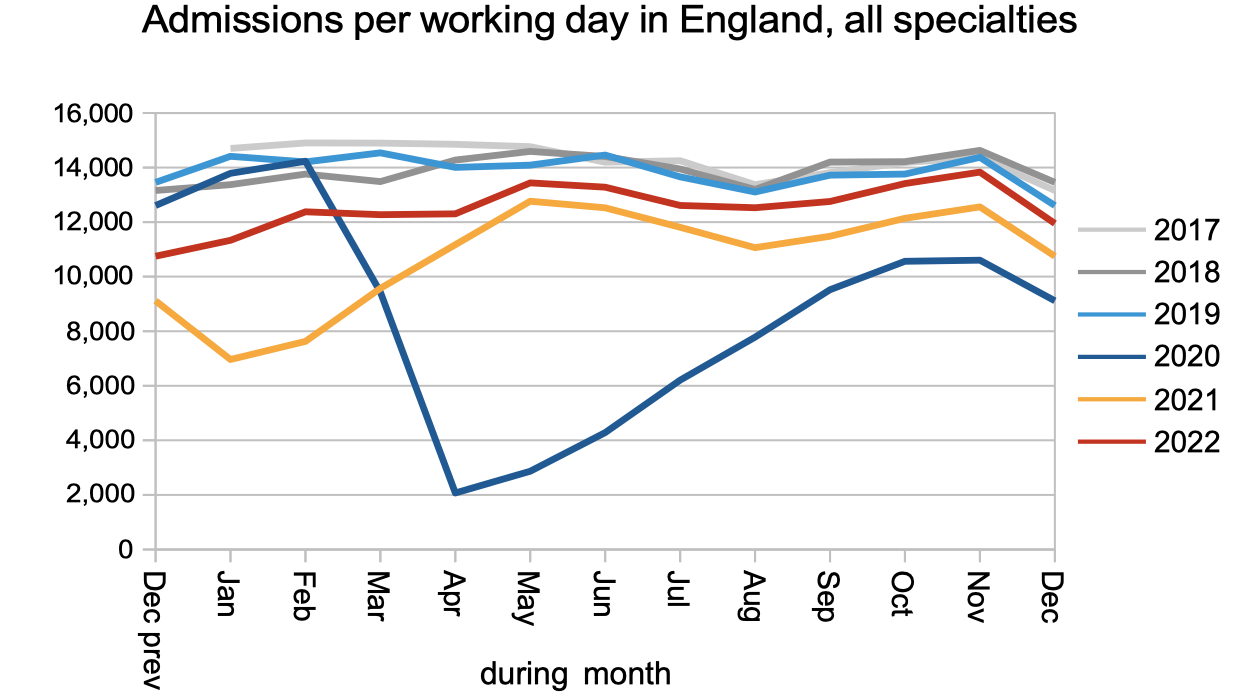
Patients continued to be admitted for treatment as inpatients or daycases at below pre-pandemic rates.
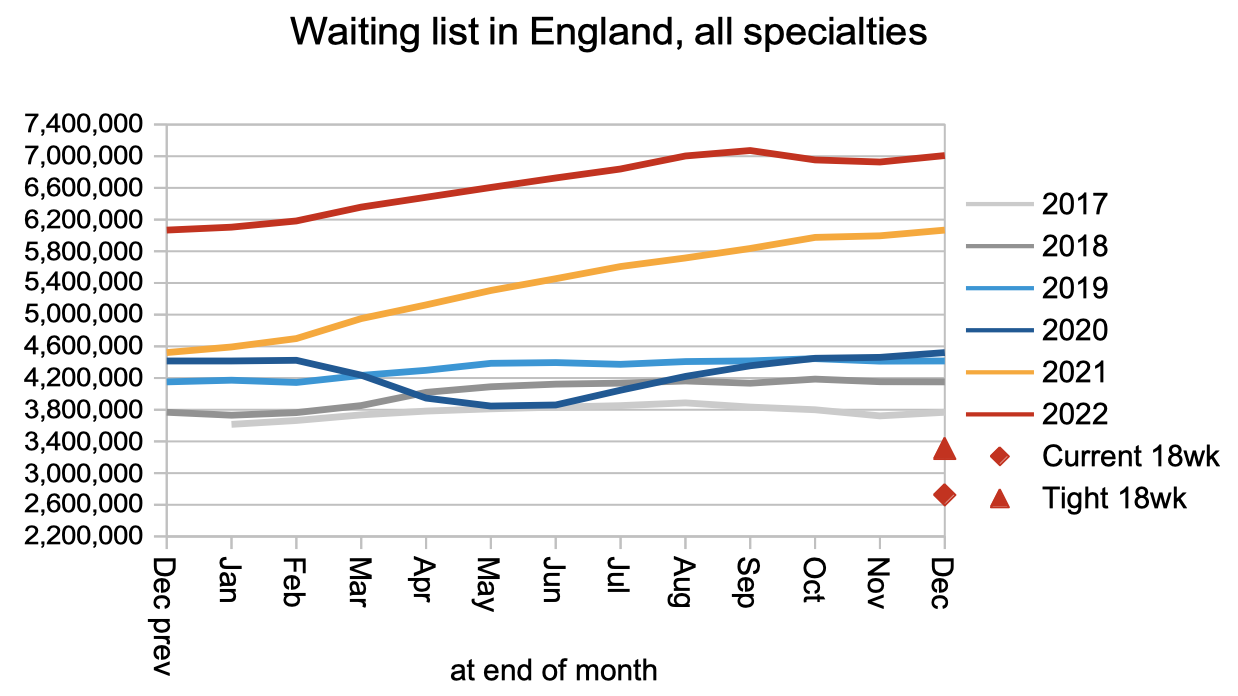
The overall referral-to-treatment waiting list, which includes patients both with and without a Decison to Admit, has roughly flatlined since September. The Institute for Fiscal Studies estimates that this will continue through 2023.
What matters to patients is how long they are going to wait, not how many other people are in the same boat. And waiting times have been rising steadily, both from referral to treatment, and within that from referral to diagnosis and decision. (But don’t try to subtract one from the other to estimate the time from diagnosis to treatment. It doesn’t work like that.)
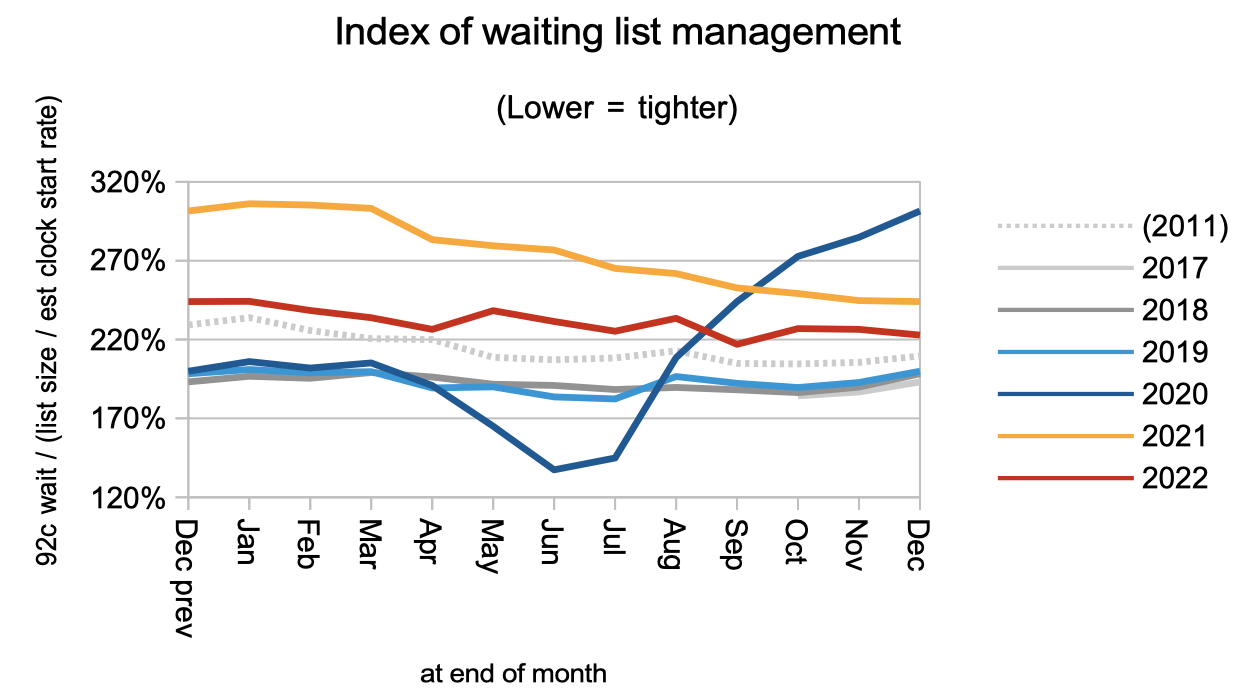
Waiting times are a function of both the size and shape of the waiting list. The shape improved suddenly after the current incomplete pathways target was announced in late 2011, but during the pandemic it deteriorated sharply as waiting times because more variable around the country. It still has not recovered.
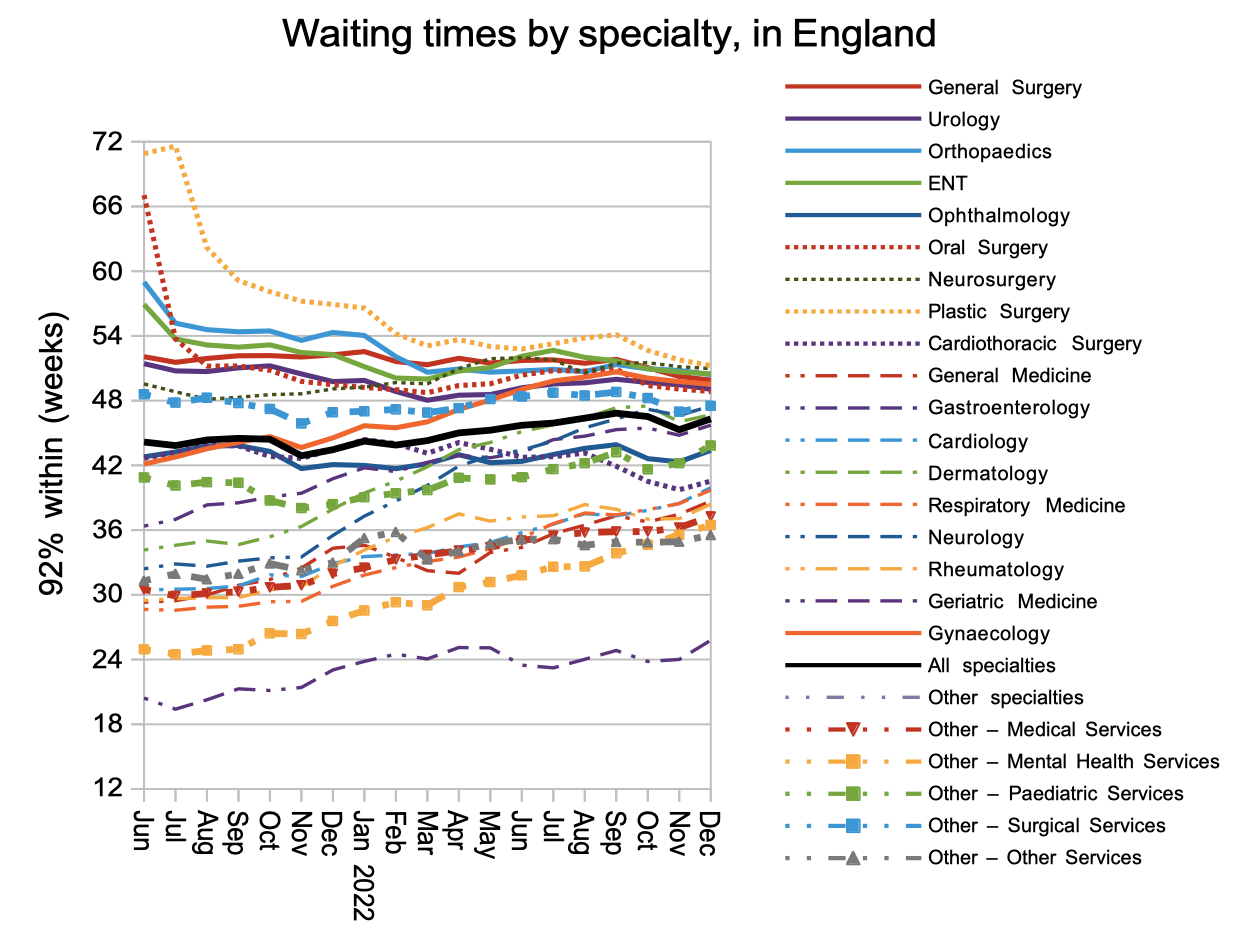
At specialty level, waiting times continue to converge as the longest RTT waits come down while overall waiting times rise in the middle of the pack.
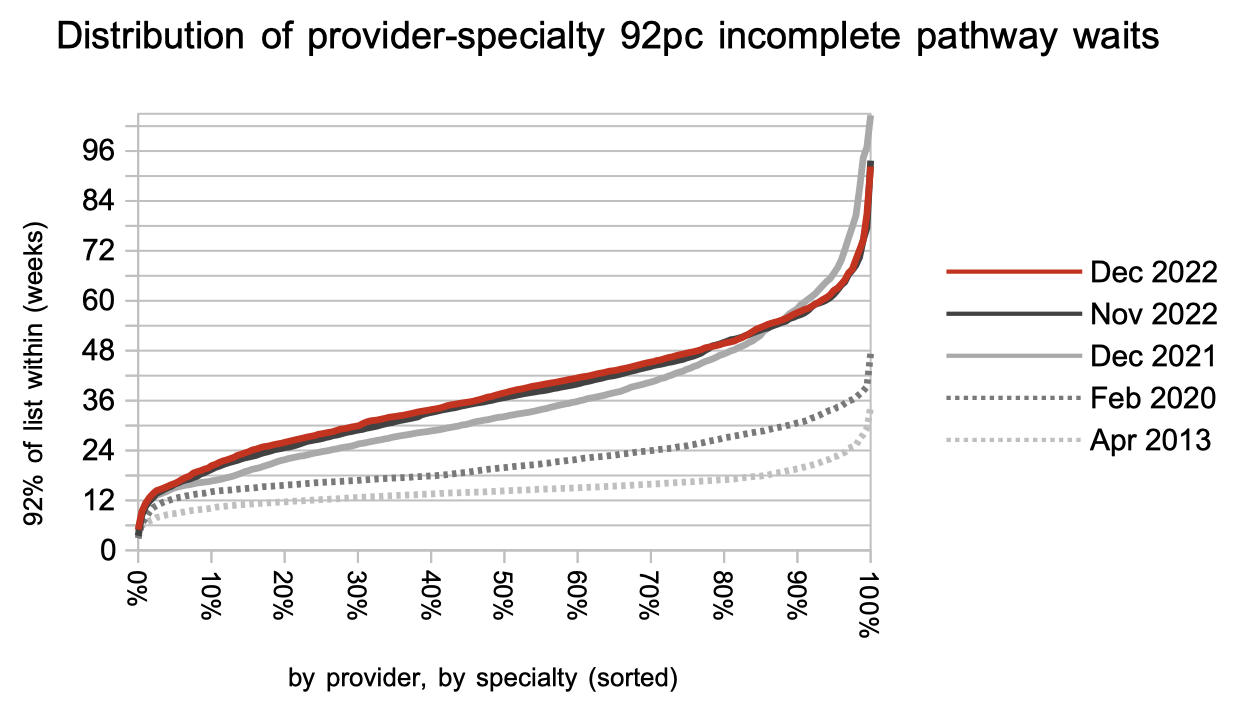
The distribution of waiting times, at 2,500-odd local specialties within providers, also shows waiting times creeping up in the middle of the pack while the extreme long waits fall in response to government targets. As those targets tighten further, and the underlying pressures fail to reduce, more and more local services will find that the targets are simply unachievable because of the sheer size of their waiting list.
Referral-to-treatment data up to the end of January 2023 is due out at 9:30am on Thursday 9th March.