

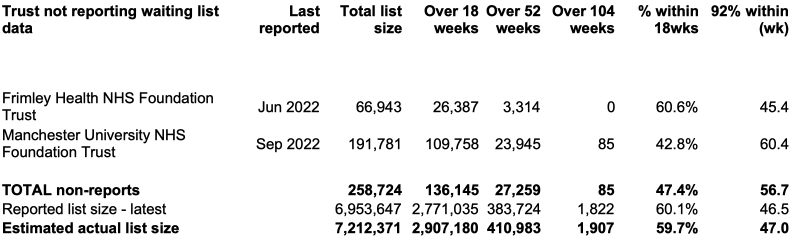
The English referral-to-treatment (RTT) waiting list grew to a new record of over 7.2 million patient pathways in October, after adjusting for the trust with the biggest RTT waiting list in the country going missing from the data. Waiting times nationally rose to 47.0 weeks.
Analysis produced for Health Service Journal by Dr Rob Findlay, Director of Strategic Solutions at Insource Ltd and founder of Gooroo Ltd
The published figures suggest a small drop in the number of 104 week plus waiters from 2,239 to 1,907. However this may be flattered by new guidance which allows trusts to omit some patients from their reported figures, as NHS England paint themselves into a policy corner as a result of their poorly formulated target to eliminate such waits.
On the plus side, the statisticians at NHS England have helpfully started reporting the various long wait milestones with adjustments included for non-reporting trusts, and they have also used the adjusted figures in the official Statistical Press Notice, so journalists now have easy access to long wait figures that are not severely affected by non-reporting trusts.
In the following discussion, all figures come from NHS England. If you have a national statistic that you’d like to check up on, you can download our waiting times fact checker. For analysis of waiting times performance at a particular organisation, visit our reports page, or our map of the latest elective waiting times across England.
The numbers
The reported numbers in October are heavily affected by Manchester University NHS Foundation Trust being unable to report RTT data, having gone live with a major new IT system. This is the cause of the apparent surge in patients going missing from the RTT data, as shown in the England-wide data quality chart below.
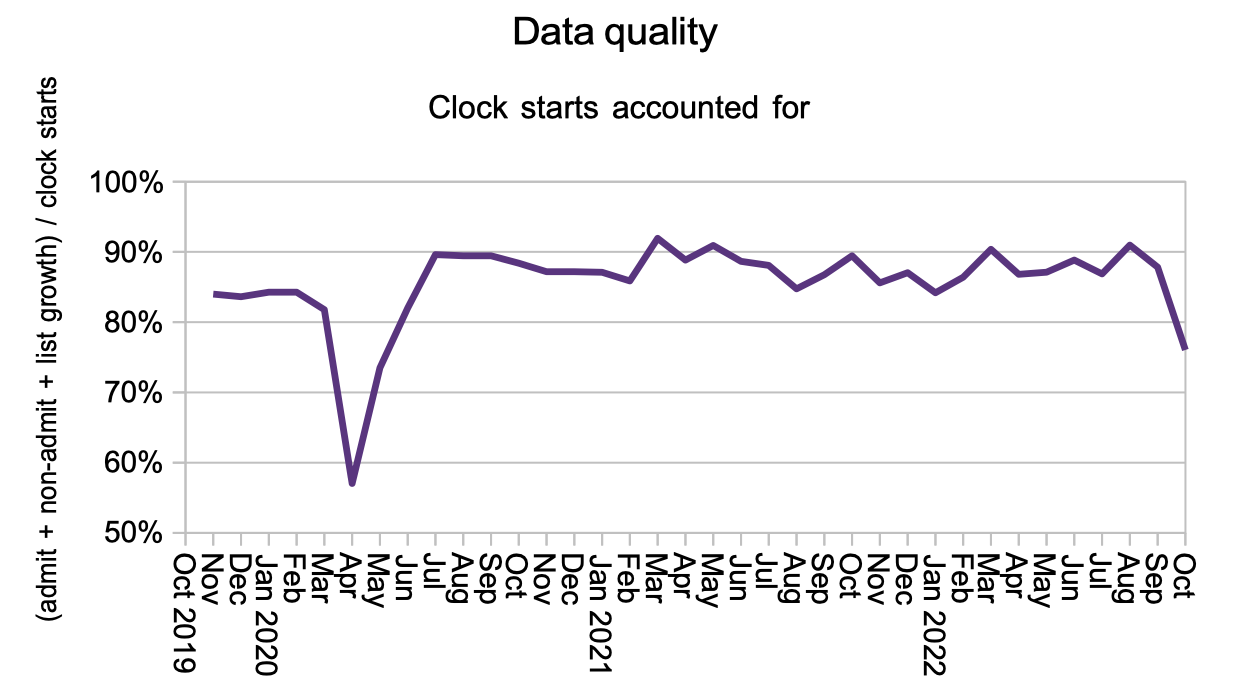
If we add missing trusts back into the data, we can see that the waiting list stood at a new record of over 7.2 million patients, with waiting times rising from 46.8 to 47.0 weeks during October.
The rest of this analysis does not adjust for the missing data.
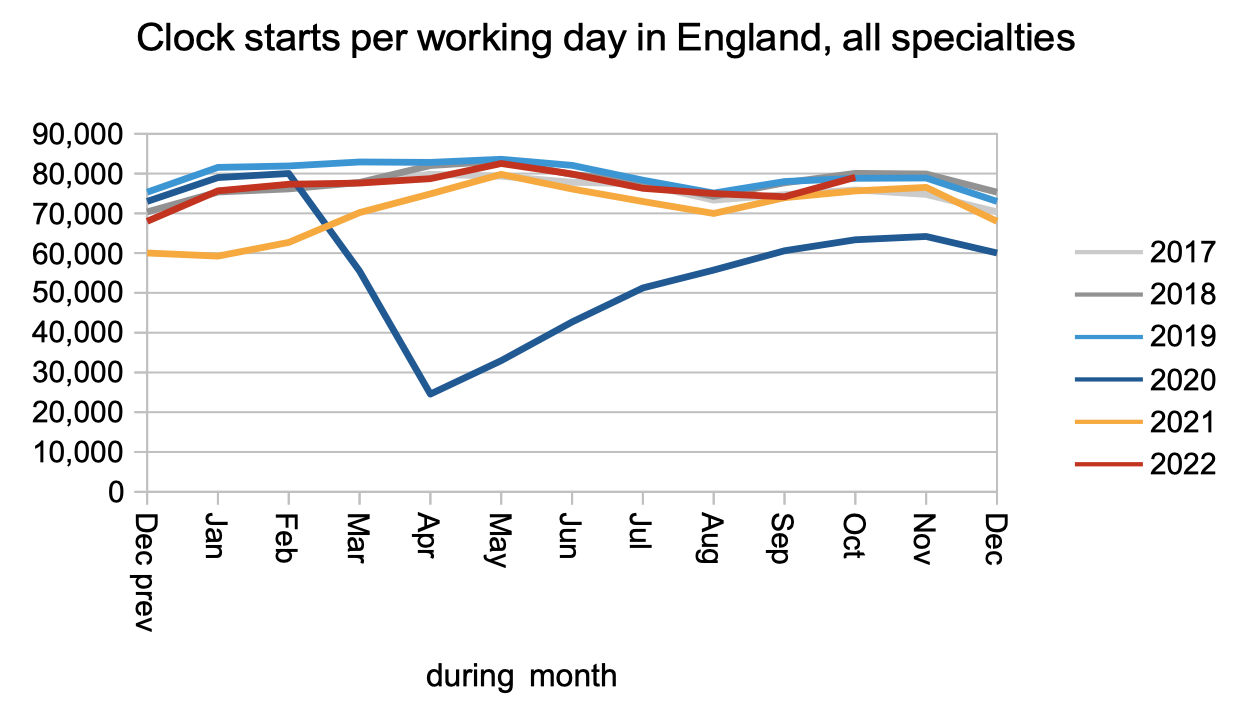
Clock starts were at pre-pandemic rates.
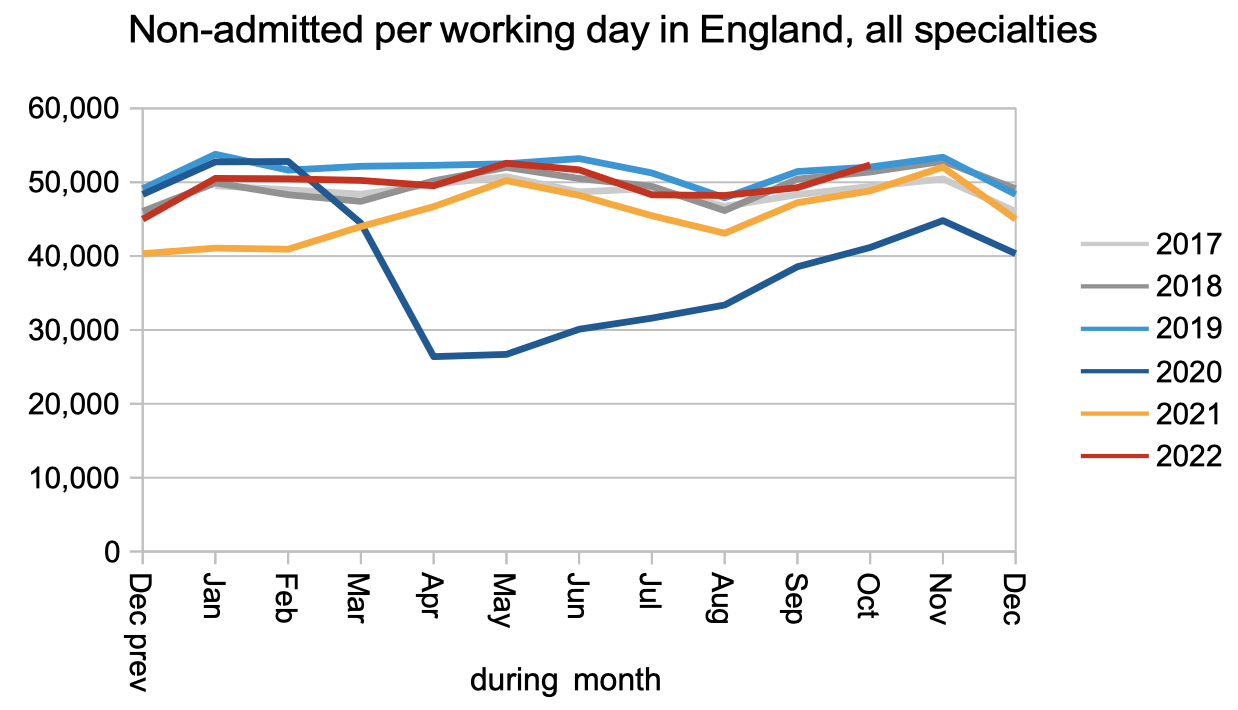
Non-admitted clock stops (broadly, patients discharged from clinic or removed administratively) were also at pre-pandemic levels.
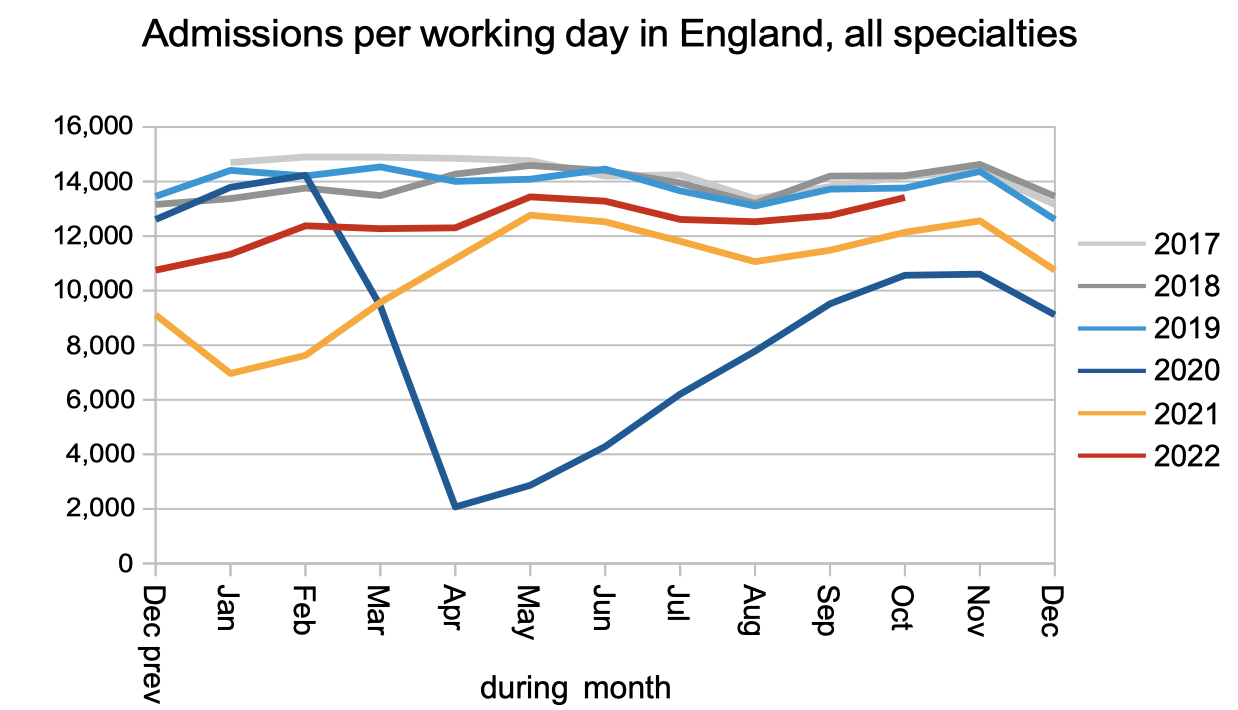
Admissions were below pre-pandemic levels.
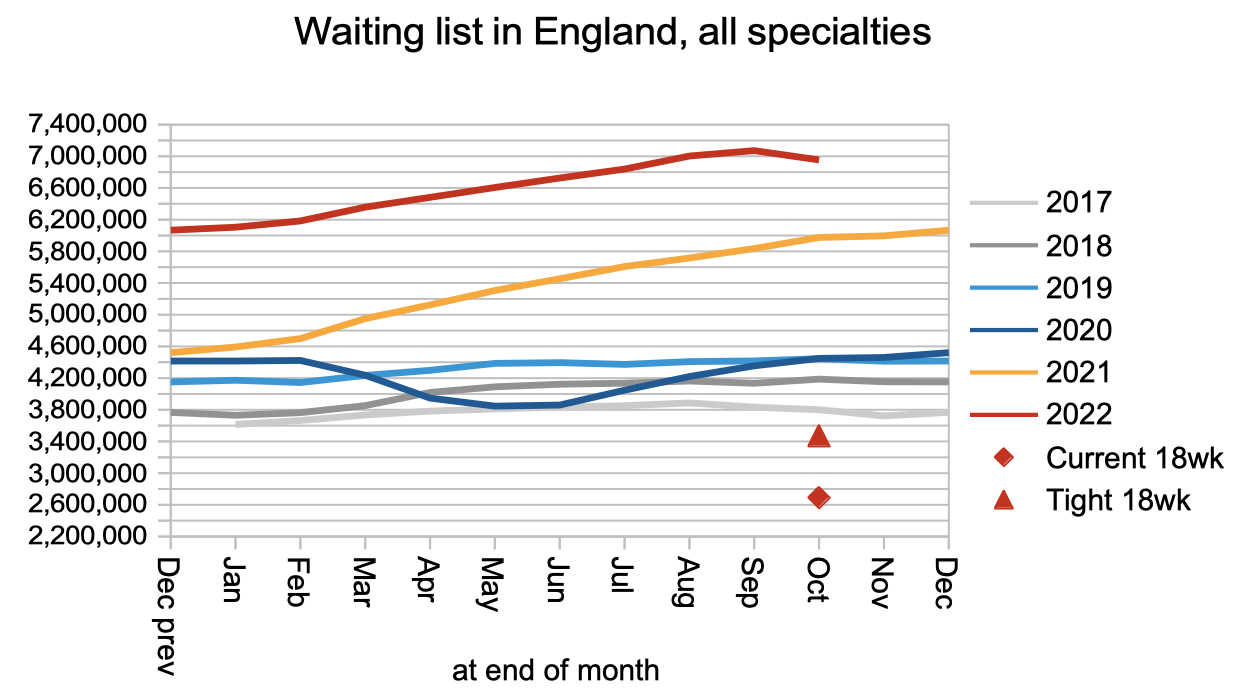
The waiting list appears to have shrunk but this is an artefact of the trust with the biggest waiting list in the country going missing from the data. If you add them back in again, the waiting list grew from 7.14 million to 7.21 million. The red triangle shows that the list size would need to roughly halve before the statutory 18 week RTT waiting time standard would be achievable again.
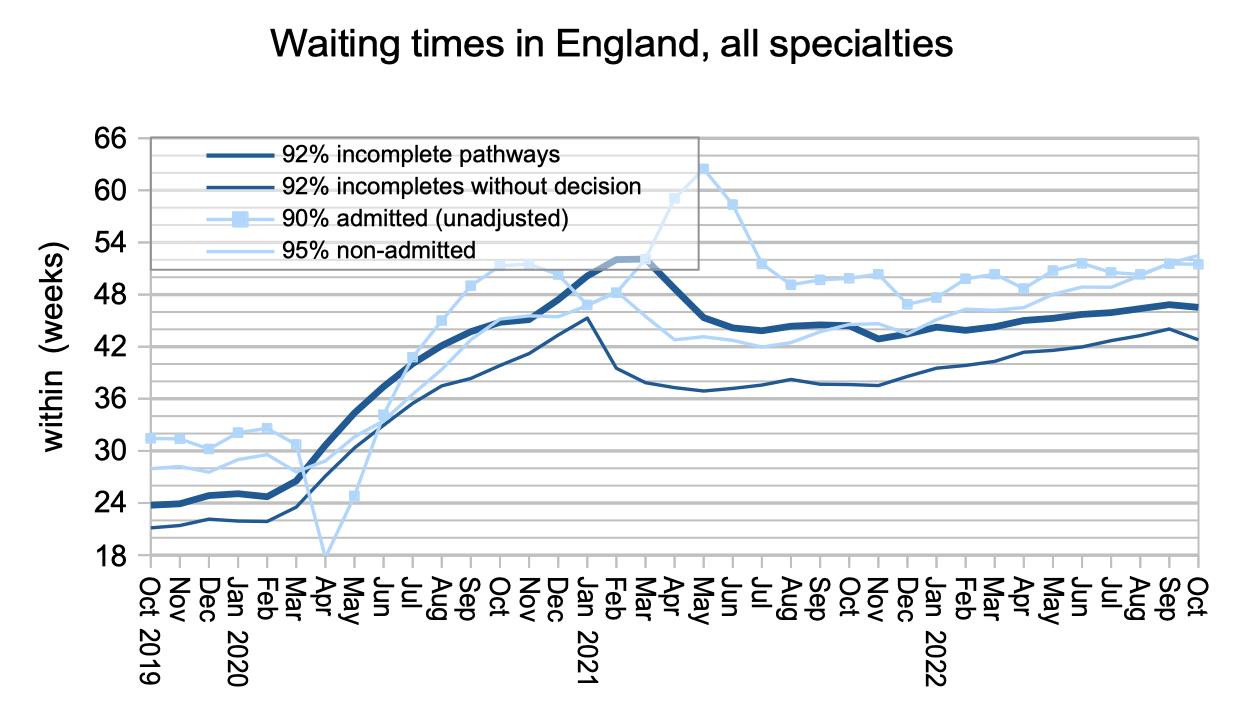
RTT waiting times grew from 46.8 weeks to 47.0 weeks. The dip in the chart below is again an artefact of the missing data.
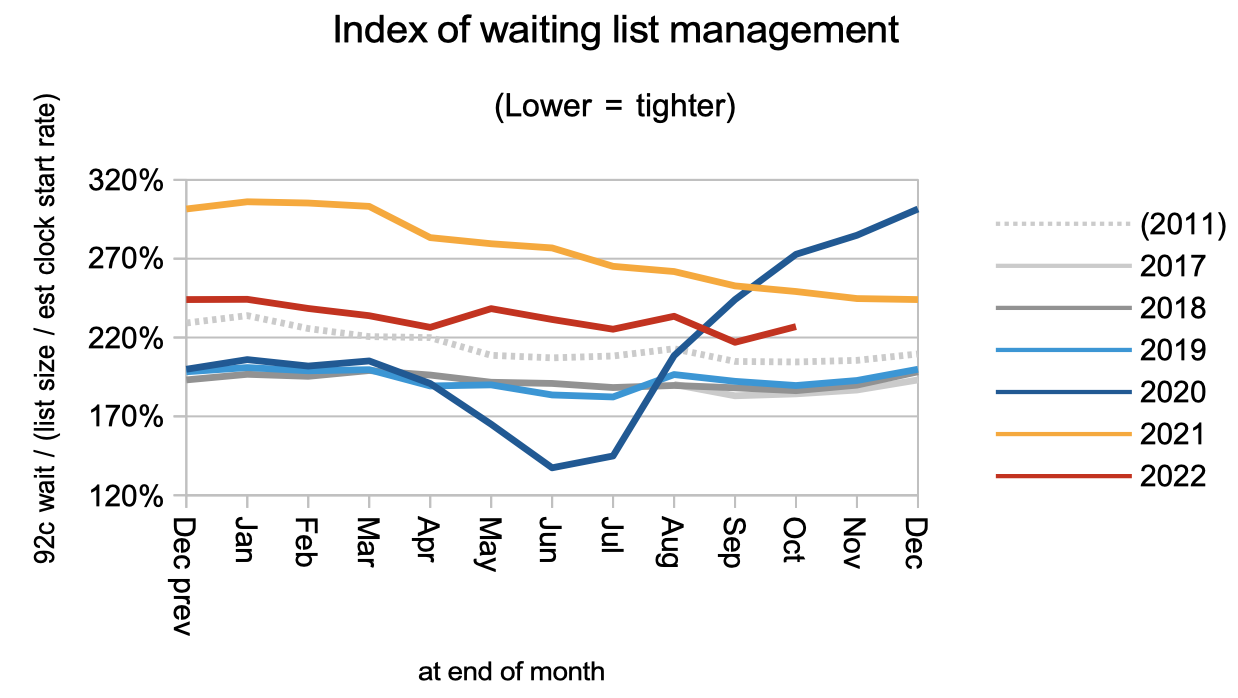
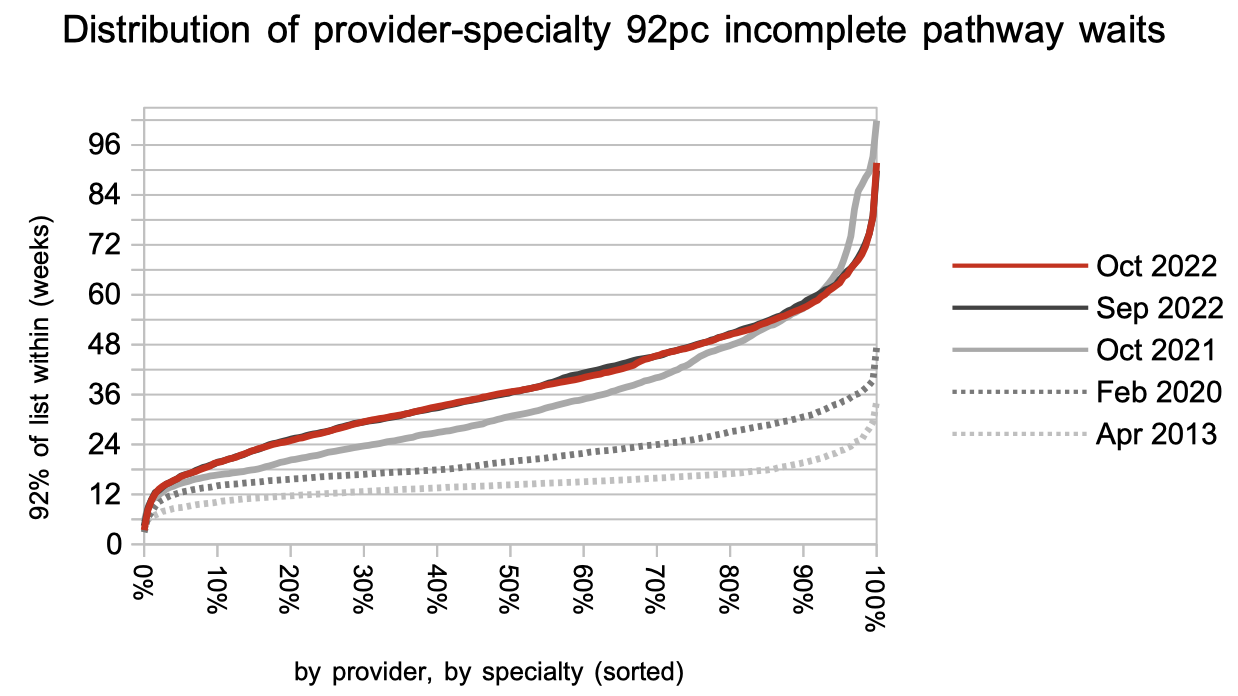
Waiting times are a function of both the size and shape of the waiting list, and the shape is summarised in the chart below. The shape is less tight than pre-pandemic, largely because of variation in waiting times around the country. In the waiting time chart above, the red triangle is based on restoring the pre-pandemic shape, and the red diamond is based on the current shape.
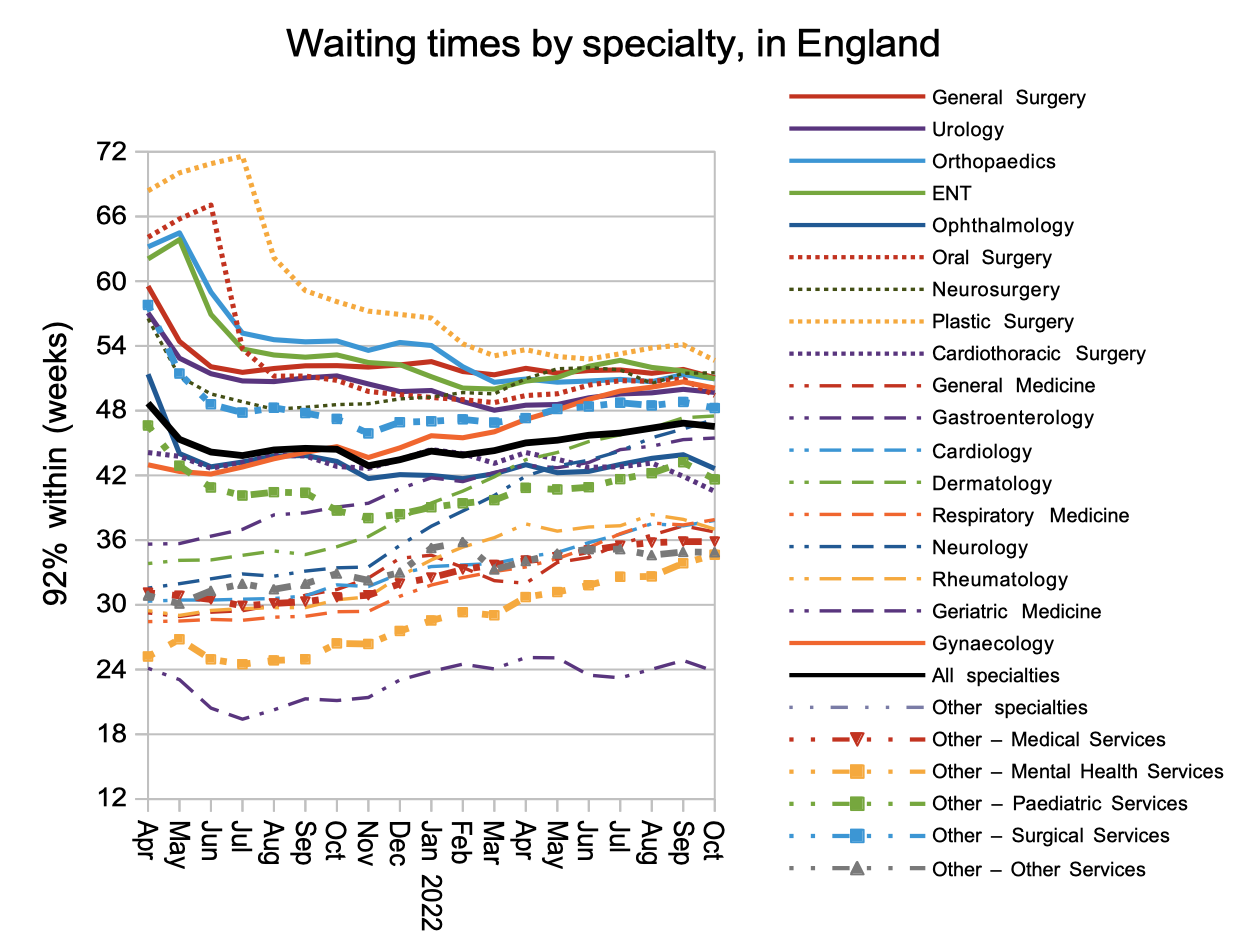
The specialty level chart is included for completeness, but may not be reliable in October because of the newly missing data. Mental health waiting times are growing particularly rapidly, although this is a partial picture because some mental health trusts are not reporting RTT data even though they have significant numbers of consultants.
The distribution of waiting times below will also be affected by the missing data, so let’s look instead at the size of the gap that needs to be closed to restore waiting times to their pre-pandemic position, and the further reduction needed to get back to the better position of April 2013.
Referral-to-treatment data up to the end of November is due out at 9:30am on Thursday 12th January 2023.