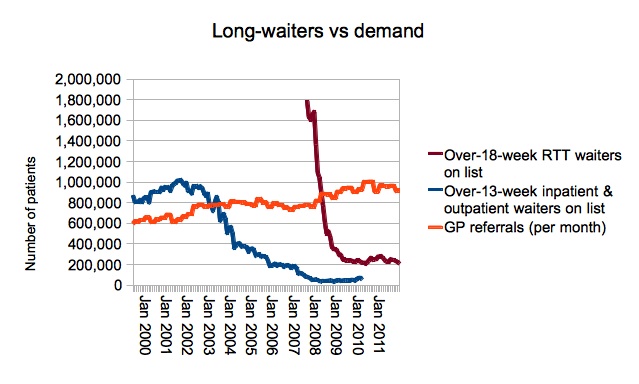
Well, does it? Here’s the evidence. You can see on the chart the steady reduction in outpatient and inpatient long-waits in the early noughties, followed by the dramatic cut in referral-to-treatment long-waits from 2007 to 2009.

GP referrals are used to indicate the level of demand, and they rise in two steps over the period. The first step doesn’t line up with the long-wait events, but the second step does coincide quite nicely with the achievement of 18 weeks.
Although it doesn’t look like much on the chart, the increase from mid-2007 is a 22 per cent step up in GP referrals over two years, which is not to be sneezed at (but hardly represents a spiralling out of control). Was it caused by the improvement in waiting times? Who knows; this is perhaps one for the health economists (who have various views on the subject).
