

We are consulting on a possible change to the way Gooroo Planner calculates waiting times, to allow for real-life patient scheduling tactics and narrow the gap between actual and calculated waiting times.
If you would like to participate in the consultation, then please email us at [email protected] with your comments.
Summary
Waiting times depend on two things: the size of the waiting list, and how patients are scheduled.
Real-life patient scheduling is unfortunately too complex, variable and inconsistent to model directly, so Gooroo Planner assumes that good scheduling practices are followed (and it took years of research just to work out how to model that). But because real-life scheduling differs from the assumptions used in Gooroo Planner, there are differences between real-life waiting times and those calculated by Gooroo Planner.
So we are consulting about whether a fudge factor should be built into Gooroo Planner to allow for those differences.
The advantage would be that modelled waiting lists, waiting times, and long wait counts could all match reality at the start of the future model. The disadvantages are that:
- It would only be a partial solution: real-life patient scheduling is commonly inconsistent and varies over time, so the fudge factor that works today may not work well next month.
- When the data is refreshed and the fudge factors are updated, it is likely that the fudge factors would change quite a lot; this would cause significant (and perhaps unsettling) variation in the activity / waiting times plan.
- It would add complexity: adding yet another thing that you would need to remember when people ask you about the modelling.
- It would introduce new inconsistency between Gooroo Planner’s calculated waiting times and the patient scheduling simulator.
- It would obscure the gains that could be achieved by improving patient scheduling.
At present, I am not sure that the advantage outweighs the disadvantages. However I am willing to do it if there is a clear mandate from users of Gooroo Planner.
1) The problem – patient scheduling is variable
Whenever Gooroo Planner does a calculation involving waiting times, it takes the two root causes into account, i.e. the size of the waiting list (relative to the rate that patients flow through it), and the order in which patients are scheduled.
The size of the waiting list is a straightforward measure, but patient scheduling is not. Scheduling is a complex task which by necessity varies significantly from service to service. In addition there is a huge variety of scheduling tactics that different services will use, and they often vary significantly from month to month. (As Tolstoy didn’t say in the opening line of Anna Karenina: “All optimally managed waiting lists resemble one another; every sub-optimally managed waiting list is sub-optimally managed in its own way.”)
Real-life patient scheduling is not necessarily driven by the needs of patients. Instead it is often driven by the waiting time target and other pressures on the service, which has the effect of making it an unpredictable, complex and inconsistent process. I don’t think it is possible for any model to capture this endless variety except in very crude terms.
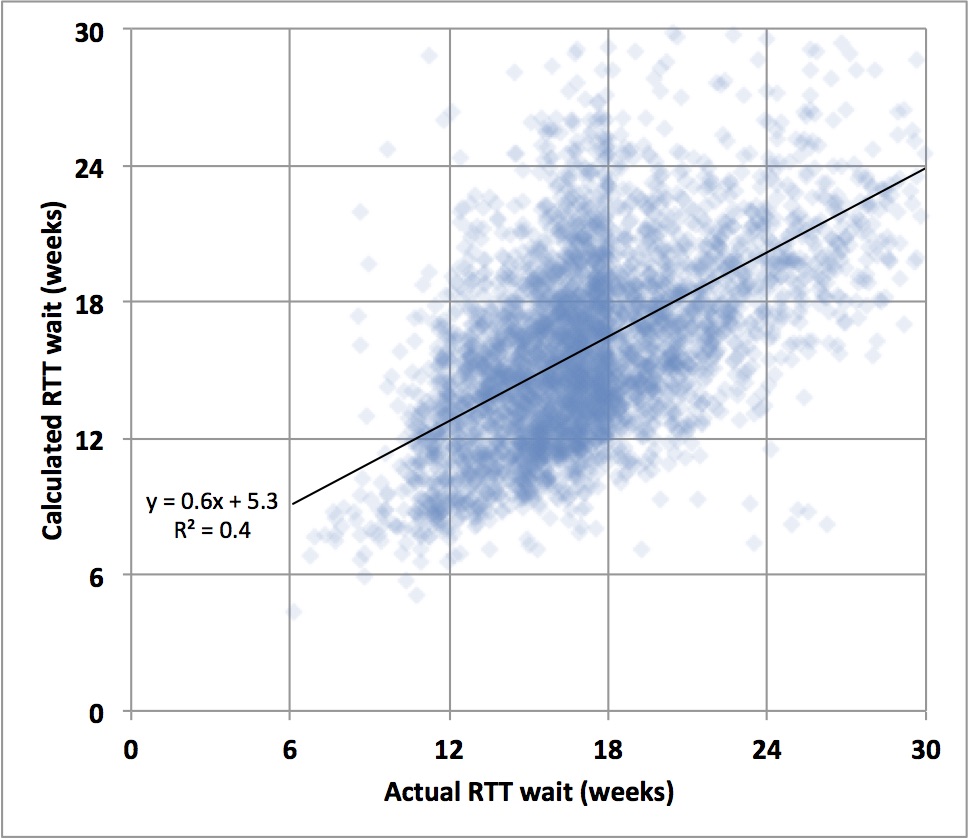
We can see the effects of this in real life. The chart below compares the actual and calculated referral-to-treatment (RTT) waiting times, by specialty and by trust, across hospital services in England. (NB: throughout this analysis I will only include services where waiting lists were a significant size, and whose clock start data cross-checked reasonably well with other data sources).
You can see a significant concentration of services whose actual RTT wait is just inside the 18 week target, covering a wide range of calculated waiting times (i.e. the waiting times you would expect given the size of waiting list and consistent patient scheduling). This illustrates how patient scheduling is often driven by targets as opposed to the needs of patients, and how those efforts can produce worse as well as better real-life waiting times. It is also a good illustration of the unpredictability of real-life patient scheduling.
The subdivision of waiting lists (for instance into subspecialty queues) is another complicating factor. The best response is to model each subspecialty separately, but you need to have enough data available to do this. The amount of subdivision may even vary over time, for instance if consultants pool their work to differing degrees depending on the relative waiting time pressures between colleagues. Again this illustrates a situation where it may not be possible to model patient scheduling directly, other than in crude terms.
2) How Gooroo Planner calculates waiting times at the moment
If there is no accurate way to model real-life patient scheduling in today’s NHS, then what does Gooroo Planner do? It assumes that scheduling is done in a particular way – using simple booking techniques which (after years of research) we concluded were a safe, fair and efficient way to schedule patients and achieve short waiting times.
(You can see those scheduling techniques in action for your clinical services by clicking the “Jump to the simulator for this service” icon in the main report tab of Gooroo Planner. You can even play out your activity plan in a patient-by-patient visualisation.)
So here we come to the problem.
The formulae that Gooroo Planner uses to calculate waiting times are based on the behaviour of our patient scheduling simulator, which is based on good patient scheduling. But real life patient scheduling often differs from that in the simulator. So although Gooroo Planner does a good job of calculating future waiting list sizes, its calculations of waiting times (and related issues such as the number of long-waiters) often vary from real life. Which can be awkward when you are trying to demonstrate that the starting point of the model matches reality.
At the moment our suggested workaround is to adjust the waiting time targets in your model, so that the starting number of long-waiters (which is the only reference point that anyone can check) is broadly consistent with real life. For instance, let’s say that in real life 90 per cent of a particular waiting list is within 10 weeks; but Gooroo Planner calculates that better scheduling would deliver 90 per cent within 8 weeks for the same list size. In this case we suggest that you subtract a “fudge factor” of 2 weeks (the actual 10 week wait, minus the modelled 8 week wait for the same list size) from your waiting time target, so that the calculated number of long-waiters over target matches reality, at least at the start of your model.
Unfortunately this solves one problem but creates another. Now the target waiting times in your Gooroo Planner model do not match the real-life targets you are required to meet, and the projected waiting times also differ. When those different waiting times appear in the results, they can cause confusion.
3) The consultation questions
This has led some users to ask whether this “fudge factor” could be built in behind the scenes in Gooroo Planner. Then the waiting list, the long-waits, and the target waiting times at the start of the model could be consistent with real life.
So the purpose of this consultation exercise is to ask users of Gooroo Planner whether they would prefer:
- to leave things as they are; or
- to introduce a “fudge factor” that adjusts the calculated waiting times behind the scenes.
If the clear feedback is to introduce a fudge factor, there are then two ways of doing it:
- adding an amount to the calculated waiting time (e.g. 2 weeks higher); or
- multiplying the calculated waiting time by an amount (e.g. 10 per cent higher).
The amount to be added/multiplied would be available as a data input into the model (via a statistical dataset), and you could use a different number for each clinical service if you wanted. By default that number would be zero, in which case no adjustment would be applied and everything would work just as it does now.
It should also be possible for Gooroo Planner to measure the fudge factor automatically from the patient-level waiting list data, although this may have to come along later as it would be more difficult to introduce. As we shall see below, it is likely that the measured fudge factor would vary quite a lot every time the data is refreshed, creating significant variation in the resulting activity/waiting times plan.
4) Pros and cons
The advantage of introducing a fudge factor is that both the waiting time and number of long-waits that appear in the Gooroo Planner outputs would be based on a starting position that is consistent with reality. Because the starting position is the only thing that anyone can cross-check, this would avoid criticisms that the opening position is unrealistic.
However there are some disadvantages that need to be considered too:
- It would only be a partial solution: real-life patient scheduling is commonly inconsistent and varies over time, so the fudge factor that works today may not work very well next month (see the line charts in the next section).
- When the data is refreshed and the fudge factors are updated, it is likely that the fudge factors would change quite a lot; this would cause significant (and perhaps unsettling) variation in the activity / waiting times plan.
- It would add complexity: adding yet another thing that you would need to remember when people ask you about the modelling.
- It would introduce new inconsistency between Gooroo Planner’s calculated waiting times and the patient scheduling simulator.
- It would obscure the gains that could be achieved by improving patient scheduling.
5) How effective would a fudge factor be?
Let’s do some analysis, based on published waiting times data, to see how effective a fudge factor would be.
We will look at two different kinds of fudge factor: an “adding” method (where a fixed amount, e.g. 2 weeks, is added to the calculated waiting times), and a “multiplying” method (where a percentage, e.g. 30 per cent, is added to the calculated waiting times).
I have tested both approaches against the reported referral-to-treatment (RTT) waiting times data, by trust and by specialty, for acute hospital trusts across England (selecting services where waiting lists were significant, and the addition rate data cross-checked well against other data sources).
As we shall see, the conclusion is that adding performs a bit better than multiplying, although it has to be said that neither method is particularly consistent over time.
The waiting time target in England is that 92 per cent of the waiting list (“incomplete pathways”) should be within 18 weeks on an RTT basis, so throughout this analysis the waiting times quoted will be the 92nd centile waiting times.
Here is how the analysis works, and we’ll do it separately for each local specialty. The first thing we need to do is calculate our fudge factor, using January 2016 data. Then we’ll take the real waiting list sizes for the next 9 months, use them to work out the calculated waiting times based on good patient scheduling, apply the fudge factor to try and make them more accurate, and compare the results with the real waiting time in each month.
So let’s start by working out the fudge factors for each local specialty. (This is based on RTT data, so the adjustment would probably be less when modelling by stage of treatment which is the usual approach when planning capacity.)
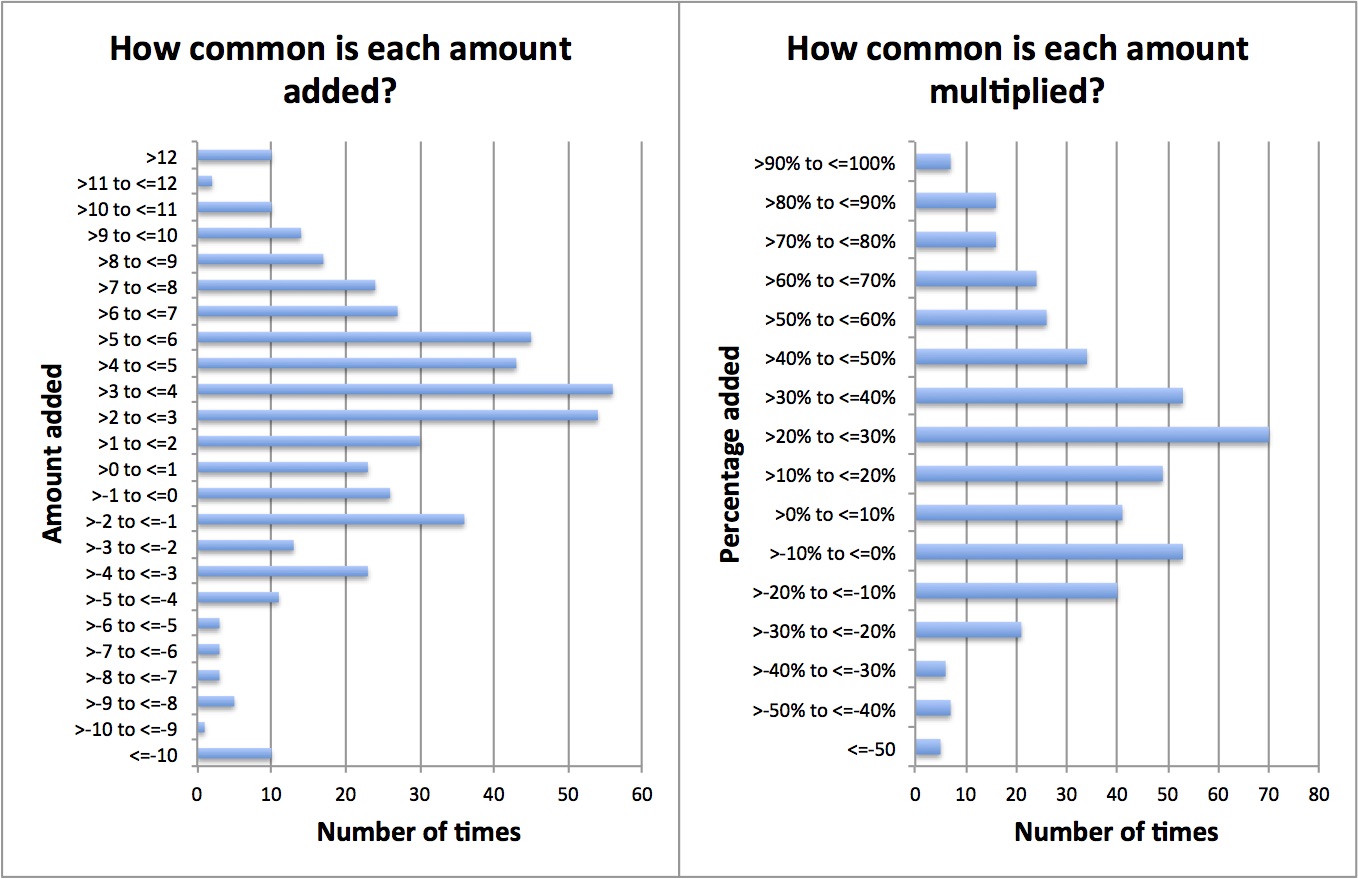
The mean ± standard deviation are: 2.4 ± 5.5 weeks for the adding method; and 27 ± 42 per cent for the multiplying method. (If your statistics is a bit rusty, about 68 per cent of the sample normally lies within one standard deviation of the mean average.) This large variation shows that quite different fudge factors would be needed for different services.
Now let’s look at how well those fudge factors work when you then apply them to subsequent months, in an effort to improve the accuracy of the calculated waiting times. The following charts show the error, even after the fudge factor has been applied: i.e. the error is the real-life waiting time, minus the adjusted calculated waiting time. In each chart, I have highlighted one service whose standard deviation is close to the average standard deviation seen across all services, to illustrate what is typical at service level. The left chart uses the adding method, the right the multiplying method.

The mean ± standard deviation for all points in months 2-11 (Feb-Nov) above are: 0.1 ± 3.7 weeks for the adding method; and 0.6 ± 4.2 weeks for the multiplying method. So the adding method is a bit more reliable, although it has to be said that with both methods the amount of variation caused by inconsistent patient scheduling is quite large.
You can see the problem. For any individual service, the actual waiting time fluctuates quite a bit compared with the adjusted calculated waiting time. Because the calculated waiting time takes account of the actual size of the waiting list in each month, the variation must be caused by inconsistent patient scheduling in real life.
6) Conclusions from this analysis
So what does this all amount to? Let’s just look at the “adding” method because it was better.
The average fudge factor was 2.4 weeks. After applying it, nearly one-third of subsequent adjusted calculated waiting times were more than 3.7 weeks away from reality. So the subsequent error is larger than the original adjustment.
This doesn’t mean that adjusting the calculated waiting time is not worthwhile. But it does show that it is only a partial solution in the face of such inconsistent patient scheduling. When you consider the extra complexity that a “fudge factor” adjustment would introduce, and that it would conceal the waiting times that could be achieved with consistently good scheduling based on patients’ needs, the question is: is it really worth it?
UPDATE: After discussion with a number of Gooroo Planner users, the consensus was that it would not be worthwhile to build in this fudge factor.