

“We’re seeing a huge jump in demand for MRI scans.”
“Oh, didn’t we tell you we’re doing a waiting list initiative?”
The biggest swings in the demand for healthcare are often NHS-induced, and this is especially true for clinical support services like radiology and pathology.
And yet it’s relatively easy to build clinical support services into your capacity planning, so that they can automatically see (and get ready for) the knock-on effects of whatever the elective specialties are planning.
Here’s a simple but powerful example showing how it all works. Let’s start with an elective service that wants to shorten its waiting times: Orthopaedic new outpatients.
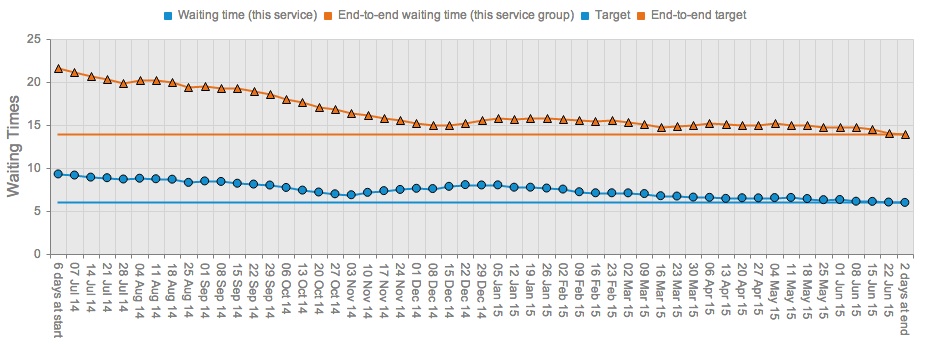
Before planning the surge – Orthopaedic new outpatient waits
The blue line shows the projected future waiting time for Orthopaedic new outpatients, which duly ends up hitting the chosen target (in this case, 90 per cent of outpatients to be seen within 6 weeks).
But it takes a long time to get there. Without changing the total amount of work done, the service can front-load some of its outpatient activity to meet the target a lot sooner. If it does that, the new waiting time profile looks like this:
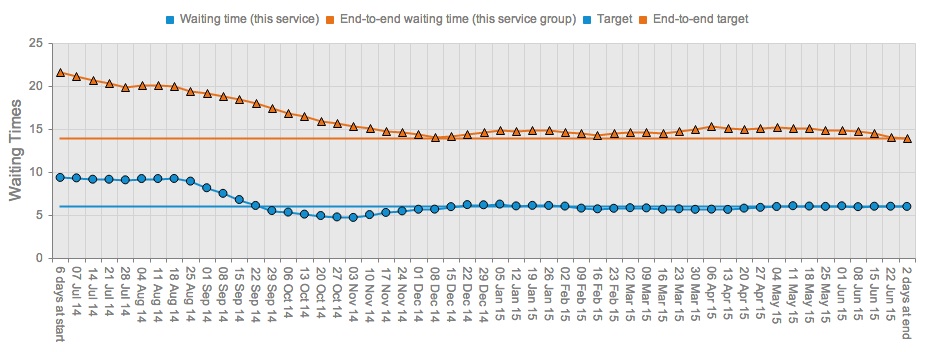
After planning the surge – Orthopaedic new outpatient waits
That’s better: now they can hit the target in September and hold it there for the rest of the year. This kind of thing is very easy in Gooroo Planner; you just click the green points in the editable profile chart, change their values, and then when the screen refreshes you can immediately see whether it’s had the desired effect on waiting times (and capacity).
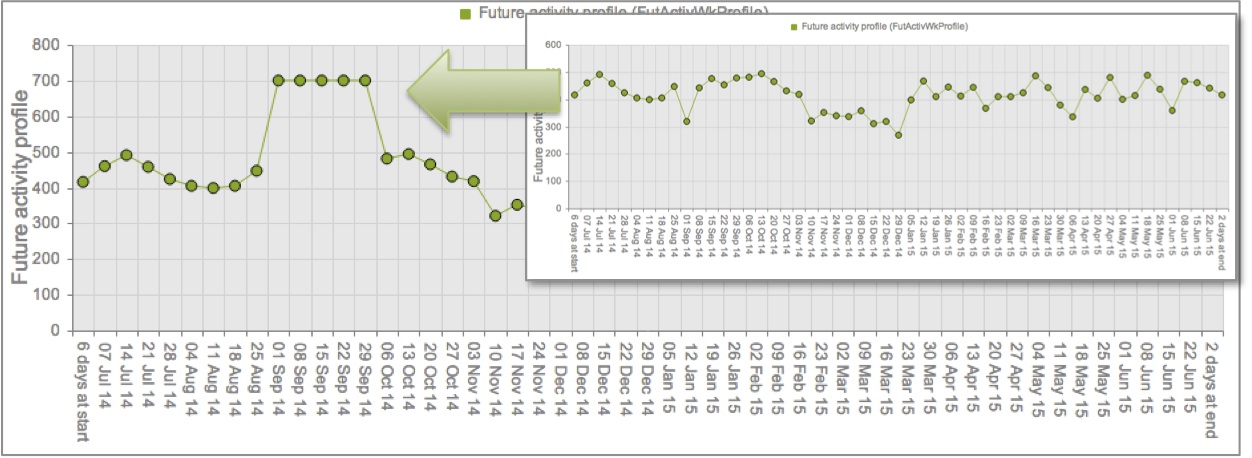
Before and after planning the surge – Orthopaedic new outpatient activity profile
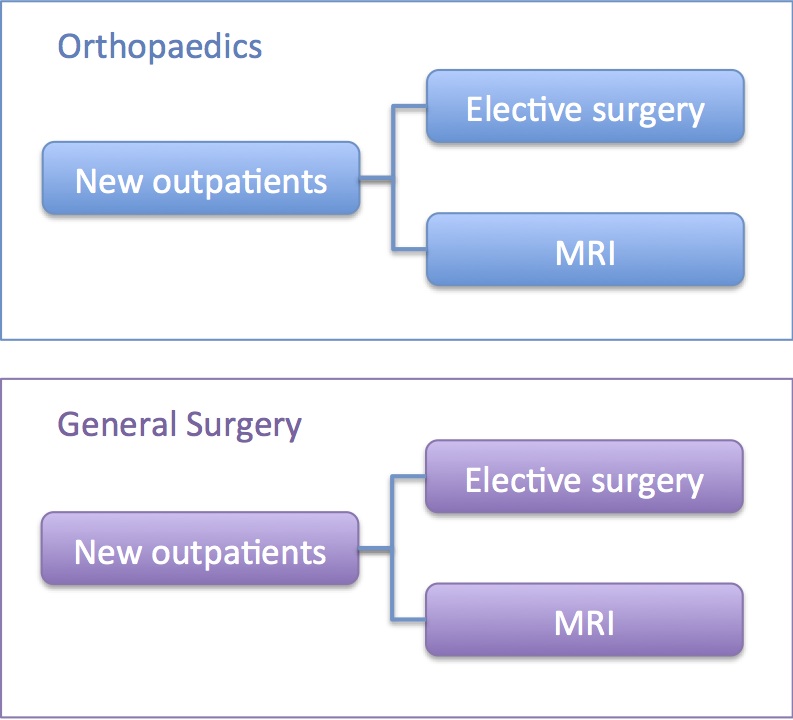
But outpatients don’t happen in isolation: they have real-world knock-on effects for other services. Gooroo users will already know how easy it is to model the knock-ons for elective inpatient and daycase services, but here we’ll look just at the effect on MRI.
In this example, I’ve set up orthopaedics MRI as being downstream of orthopaedics new outpatients. It’s important to set up separate MRI streams for each elective service, so that the different knock-ons from different elective services are captured correctly. Thus General Surgery will get its own downstream MRI service too, like this (and don’t worry: Gooroo Planner will add it all up for you later).
(You may be thinking: but that isn’t the pathway, because patients go from outpatients to MRI to surgery. You are right, but see the footnote: doing it this way enormously simplifies the modelling and still gives the right capacity plan.)
How the knock-ons work
Now we’re ready to look at the effect on MRI of our September outpatient surge.
In the chart below, the blue line shows the MRI hours per week required to keep up with demand from orthopaedics new outpatients.
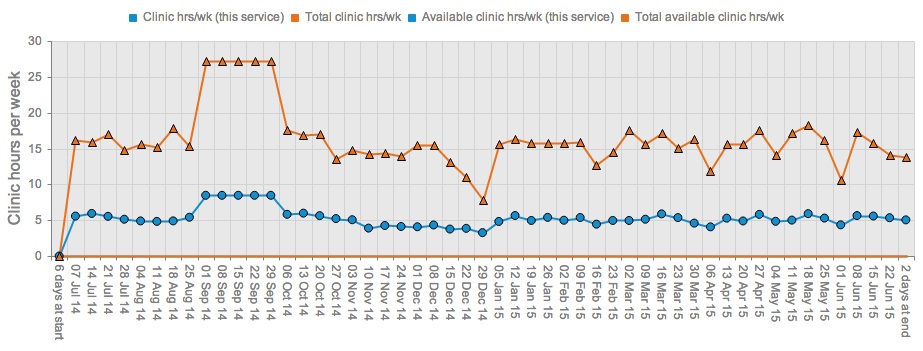
After planning the surge – MRI hours per week
I promised that the MRI requirements from all specialties would be added up for you too, and that’s what the orange line shows. (In Gooroo Planner you create this subtotal simply by using the “Restrict capacity subtotals to services with matching:” dropdown, and selecting Activity Type instead of Specialty.)
So there you have it: simple modelling, but with powerful results.
Now radiology and other clinical support services can be fully involved in planning for waiting list initiatives and other capacity changes, right down to the week-by-week detail.
We didn’t even have to do anything sophisticated, like modelling MRI as a waiting list (though we could have done). And that’s how Gooroo Planner is designed: it’s easy to get meaningful results right from the start, and you can always add greater complexity later on.