

You already know that Gooroo Planner works out the beds, theatres and clinics you need every week, so you can keep up with demand and sustain short waiting times. Here we’ll examine how that works, and how you can extend your capacity planning to endoscopy, radiology, cath lab, pathology, physiotherapy, consultant job plans, and other types of capacity.
But first: demand and waiting times
I know: you want to get straight on to capacity. But it’s worth acknowledging that there is quite a lot of calculating that needs to be done first: you need to work out how much activity you need to do, to keep up with non-elective demand and achieve your waiting times objectives.
Gooroo Planner handles all that for you, in week-by-week detail, and you can do it at whatever level of detail you can provide consistent data for (including subspecialty and hospital site). This is the essential preamble that you have to go through, no matter what else you want to work out, and Gooroo does it easily right there in the same model.
Now that you have your week-by-week activity plans ready, you can turn them into all the different types of capacity that you need to work out.
Beds
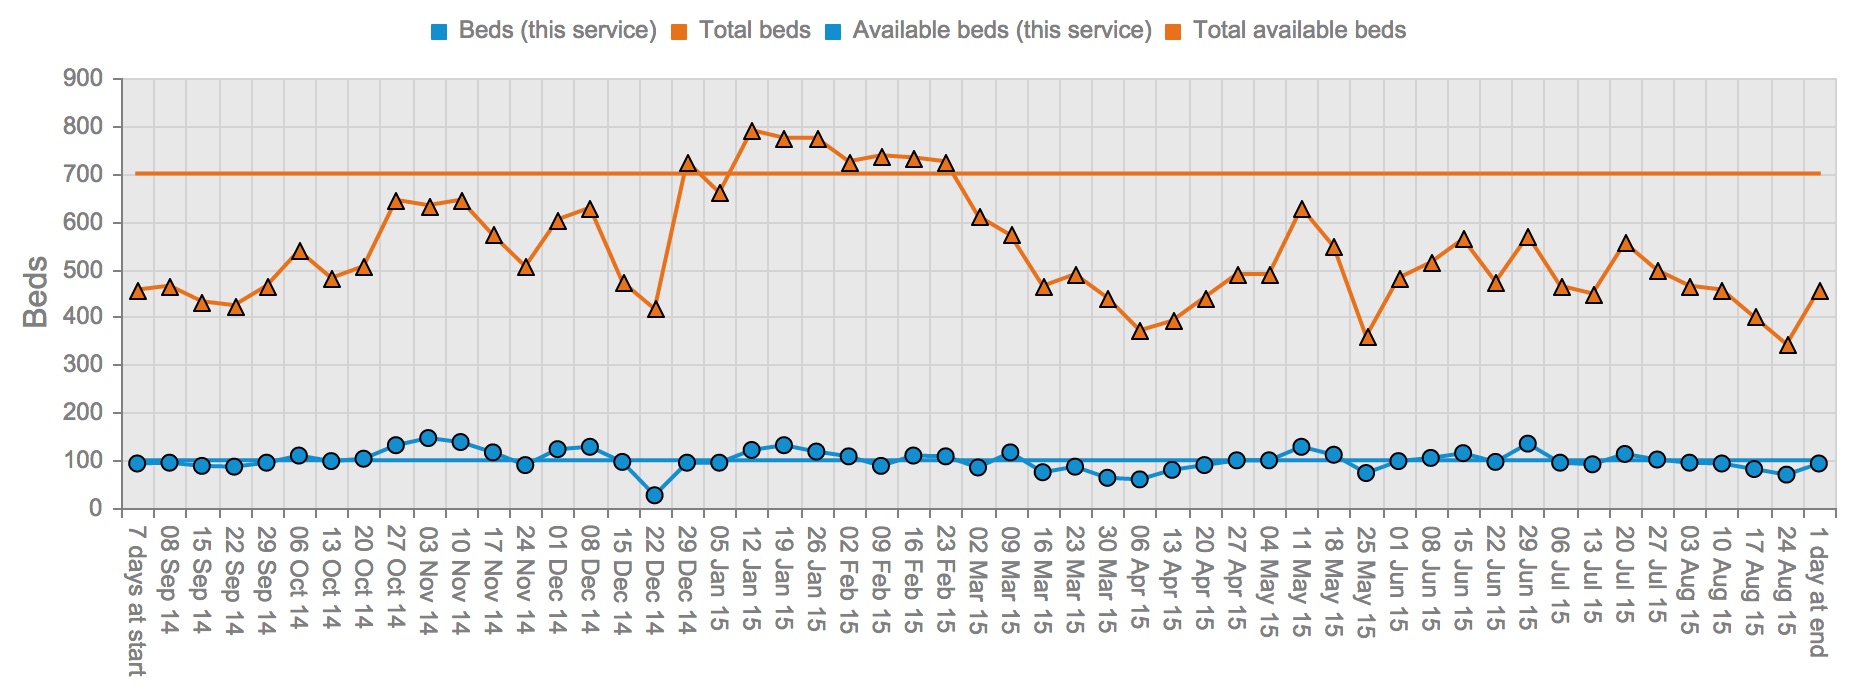
Gooroo Planner works out the beds you need every week, and also shows your total bed requirement so that you can see if you have a bed crisis looming.
What kind of ‘total’? Whatever you like: it could be the entire hospital site, but usually you would total across the main medical and surgical bed pool, and do separate totals for ITU, obstetrics, paediatrics, and other ring-fenced beds.
In the following example, you can see there is a total of 700 physical beds for electives and emergencies across the acute bed pool (the straight orange line), and in January and February there will be a bed crisis because the total number of beds needed (variable orange line) exceeds the number available.
The blue line shows the number of beds needed by the service we’re looking at here: elective inpatient Orthopaedics. Its bed requirements vary through the year, and you can see there might be potential to reduce activity in winter to alleviate the bed crisis. (Gooroo Planner even helps you plan elective activity through the year so that waiting times don’t breach during this winter slow-down.)
Beds week by week
If you are using the Planner API, you can integrate these week-by-week plans automatically into your performance management system, whether that uses Excel spreadsheets, or is a proper dashboarding system like Tableau or QlikView.
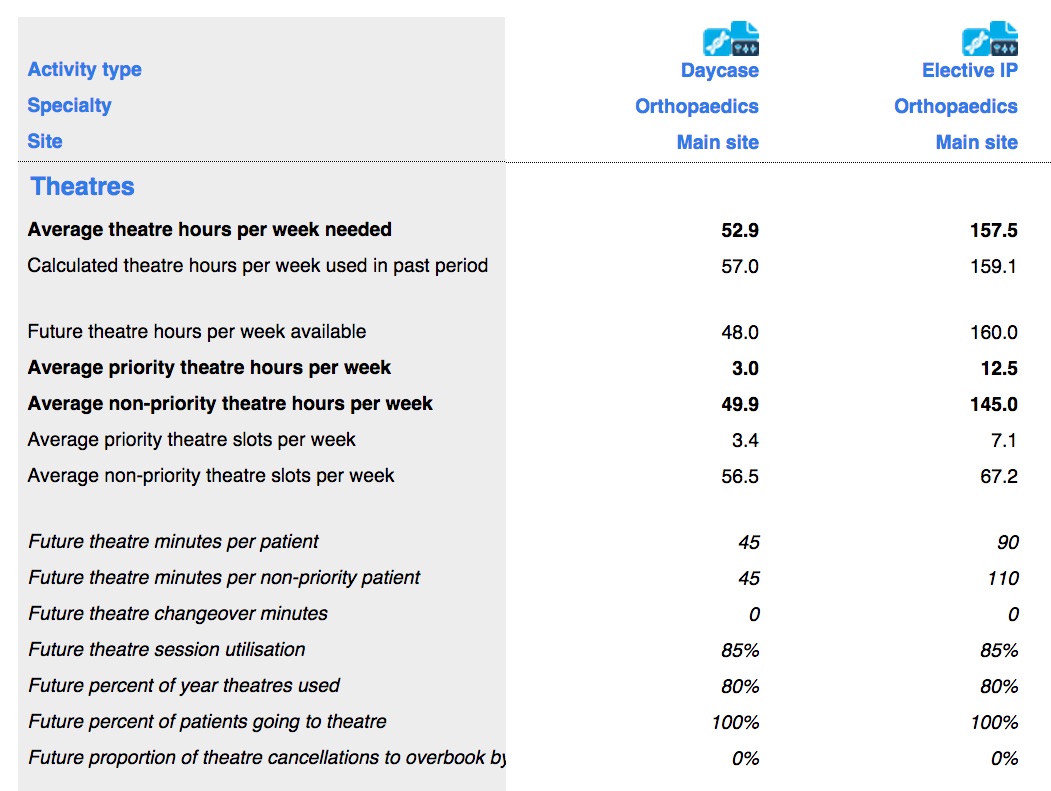
Gooroo Planner also works out the overall picture: the average beds you need in every service. Then you can see quickly which services have too many beds and which have too few. The following screenshot shows daycases (for which no beds are modelled – though you could if you wanted to), and elective inpatients. This is just for orthopaedics, although in a real model you would also include the rest of the hospital including emergencies.

Beds overall
What sort of beds data do you need to input into Gooroo Planner to get this?
- If you enter the actual number of beds you have available, then it can draw the straight lines on the chart above and compare what you have with what you need.
- You’ll need the average length of stay for each service, which you can split between urgents and routines so that the differences are accounted for when doing waiting list initiative calculations; Gooroo Planner measures these lengths of stay for you when you upload patient level activity data.
- Bed occupancy figures are an input into the model, and the best way to calculate these is with Gooroo Beds. Typically you will use the same figure across all services that use the main bed pool, and lower occupancy figures for the smaller non-elective bed pools such as obstetrics, paediatrics, ITU etc.
- Finally, if some patients score as activity but do not use a bed then you can enter the proportion of activity that does use a bed.
Theatres and clinics
Theatres and clinics are both calculated using the same methods, so we’ll cover them together. Let’s start with the average workload:
Theatres overall
The bottom section of this screenshot (in italics) shows the performance assumptions that went into the calculations. The top section shows the average theatre requirements (across 42 working weeks a year in this example). You don’t have to lay the numbers out like this; other report styles are provided and you can customise them if you want something different.
For those who want to delve into the method, the exact formulae used to calculate theatres are published in the Planner documentation.
You can upload patient-level theatre data from your theatre system directly into Gooroo Planner (don’t worry: no patient identifiers are involved), and it will automatically measure all your performance metrics for you: operating times, utilisation, availability, and weeks worked. You only need basic data for each patient: just the service they were treated in (e.g. orthopaedic daycases), the theatre session ID, the length of that session, and the operating time (based on knife-to-skin, or needle-to-recovery, or whatever other measure you prefer).
If you have some different performance assumptions that you would prefer to use instead of the measured values, then these can easily be substituted.
The next screenshot shows an example theatre workload for orthopaedics: elective inpatient hours per week in blue, and total elective hours including daycases in orange. (As always, you can control which services are included in the totals.) The most prominent dip is Christmas week, and the skiing season at Easter is also clear.
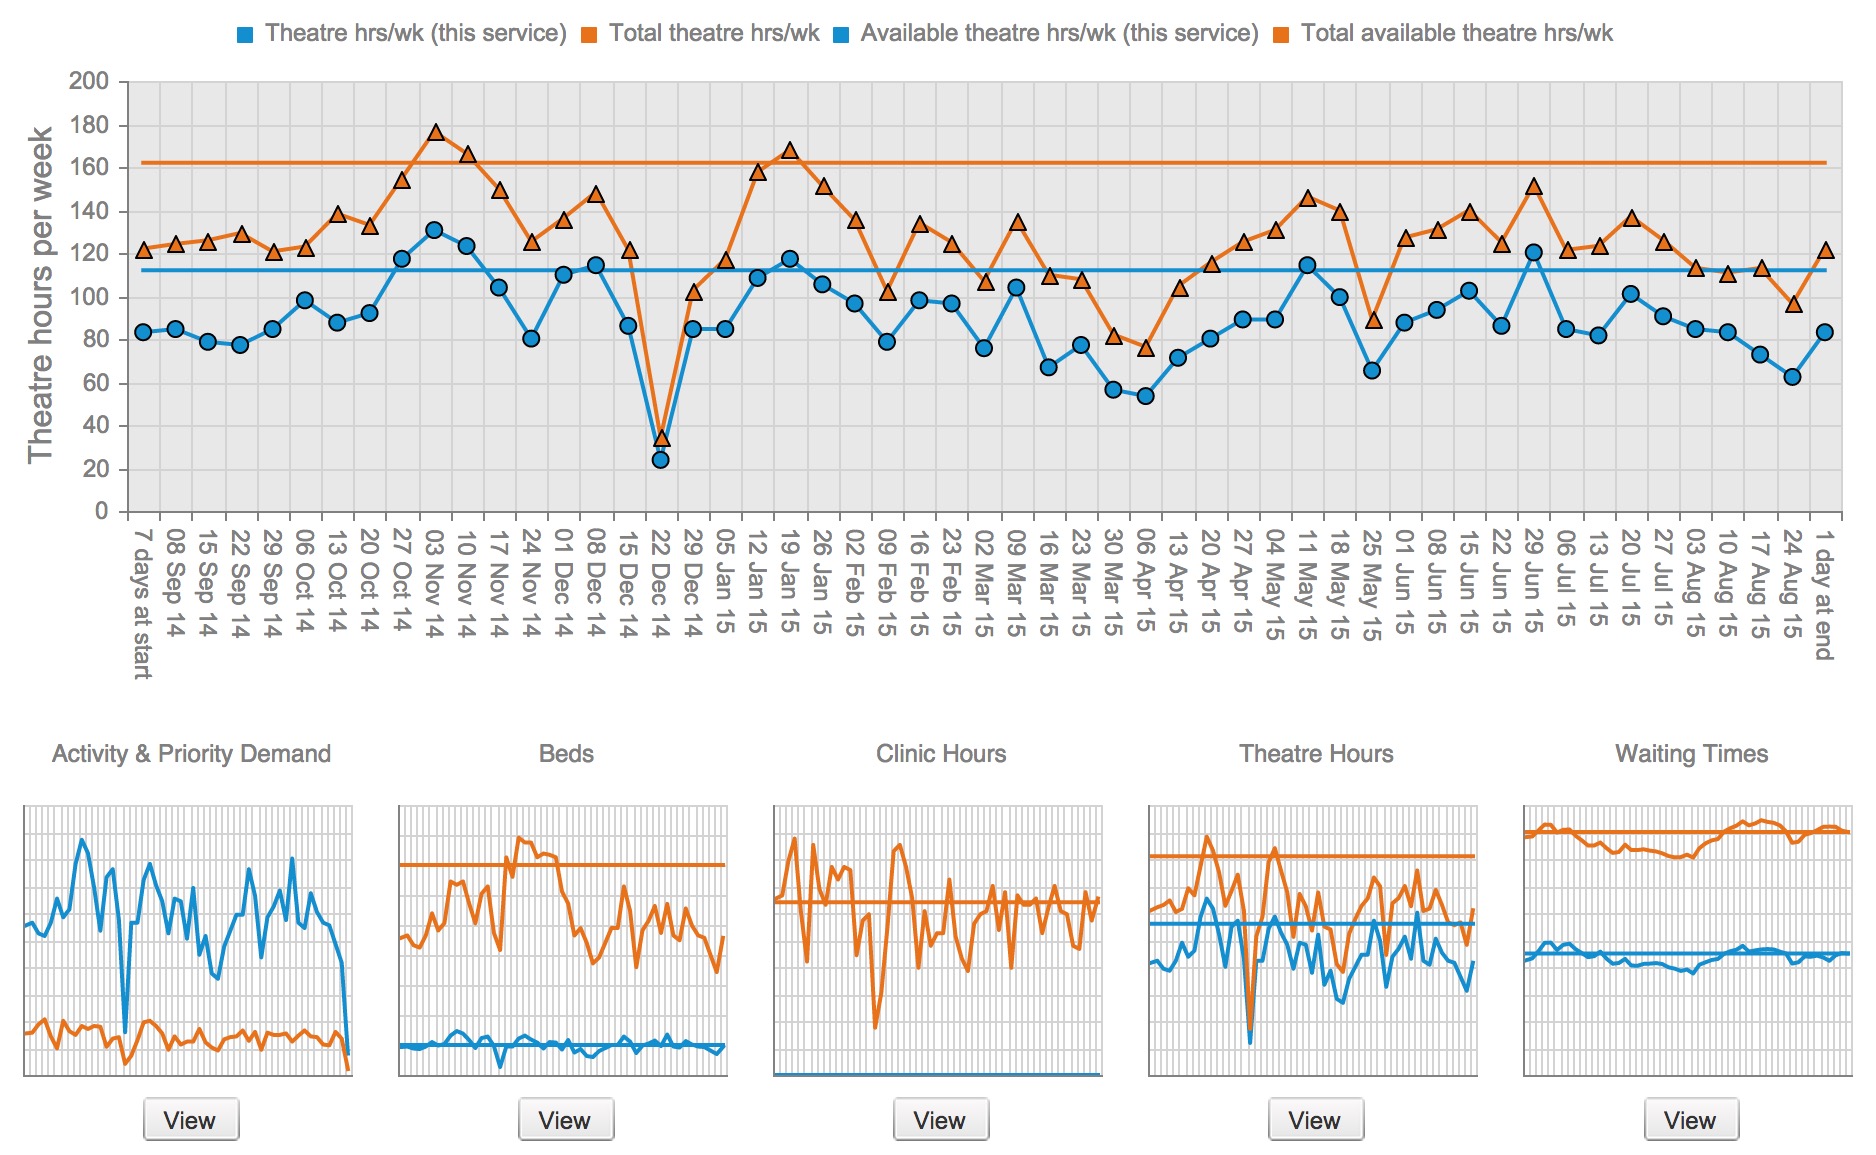
Theatres week by week
As I mentioned before, clinics are calculated in exactly the same way, using the same kinds of performance metrics. So you can choose the time per patient, the utilisation, and the clinic time available, and it’s easy to subtotal clinic times across new and follow-up patients to get the totals.
Other kinds of capacity
The theatre and clinic calculations can be used to work out other kinds of capacity too, such as endoscopy, radiology, pathology, cath lab, and physiotherapy. You can even automatically calculate the knock-on effects of events elsewhere in the hospital.
For instance instead of having endoscopy lumped together with surgical daycases, you can split your activity into elective daycases that go through theatres, and endoscopy daycases. Then you can easily subtotal endoscopy work across all specialties to see the overall and weekly workload for the endoscopy suite through the year.
You can also use your capacity modelling to work out consultant job plans, because the hours worked every week add up to the clinical programmed activities (PAs). Job planning, like any other kind of capacity planning, needs to be based on a proper calculation of the activity needed to keep up with demand and sustain your waiting times objectives, so Gooroo Planner is the easiest way to calculate the clinical PAs you need.
If you wish, you can work out clinical PAs directly by running Gooroo Planner at consultant level, which effectively assumes that each consultant is an independent service. However it is usually closer to reality if you pool consultants into subspecialties and then model at that level of detail instead, to get subspecialty-wide PAs which can then be divided between the consultants.
Beyond healthcare
Backlogs, flows, capacity, demand… these concepts are not unique to healthcare. Any caseload service or bureaucracy with persistent queues can benefit from Gooroo’s approaches to waiting times and capacity. Actually you could argue that if something works in healthcare, it is probably over-engineered for other applications and should handle them with ease.
So whether you are integrating into social care, or concerned about a backlog for assessments, or even want to plan the seasonal capacity for a purely administrative function, consider using Gooroo Planner.
If you want to model social care around discharges from hospital, you could integrate social care planning into your main NHS capacity plans. Then your social care capacity plans can automatically reflect the foreseeable peaks and troughs in hospital care.
Beds, theatres and clinics – yes, but there’s so much more to capacity planning as well. Why not turn Gooroo Planner to the rest of your health and social care services?