Sometimes the simplest-looking questions are the hardest to answer. Such as:
and more specialist ones like
- What waiting time target can we achieve?
I was first asked this question back in 1994, when I was writing the business case for a hospital rebuild. No problem, I thought, there will be a formula in the Capital Investment Manual. But there wasn’t.
Alright then, there must be a well-known formula that other people have used in other business cases. Nope.
What about the Department of Health’s operational researchers, surely they must have a formula? Well it turns out they did have a model – for the national waiting list – but they treated the waiting list as if it were a natural phenomenon instead of something you could manage. The consequence was that their waiting list always had a long tail on it, and the tail simply extended or contracted if the list got bigger or smaller. When modelling at national level there is some justification for this, because the national waiting list is made up of tens of thousands of separate lists that are all different. But it didn’t help me to model individual specialties in a single hospital: a level at which the list and its “shape” can be managed.
At that point I realised that there was no formula, and if I wanted one then I would have to derive it myself. The difficult bit was linking the number of patients waiting to the time they waited. When I eventually found the solution, it turned out to be so useful that it quickly turned into a business. Within a few years I was introducing it into half the hospitals in Britain, and working with a number of governments here and around the world.
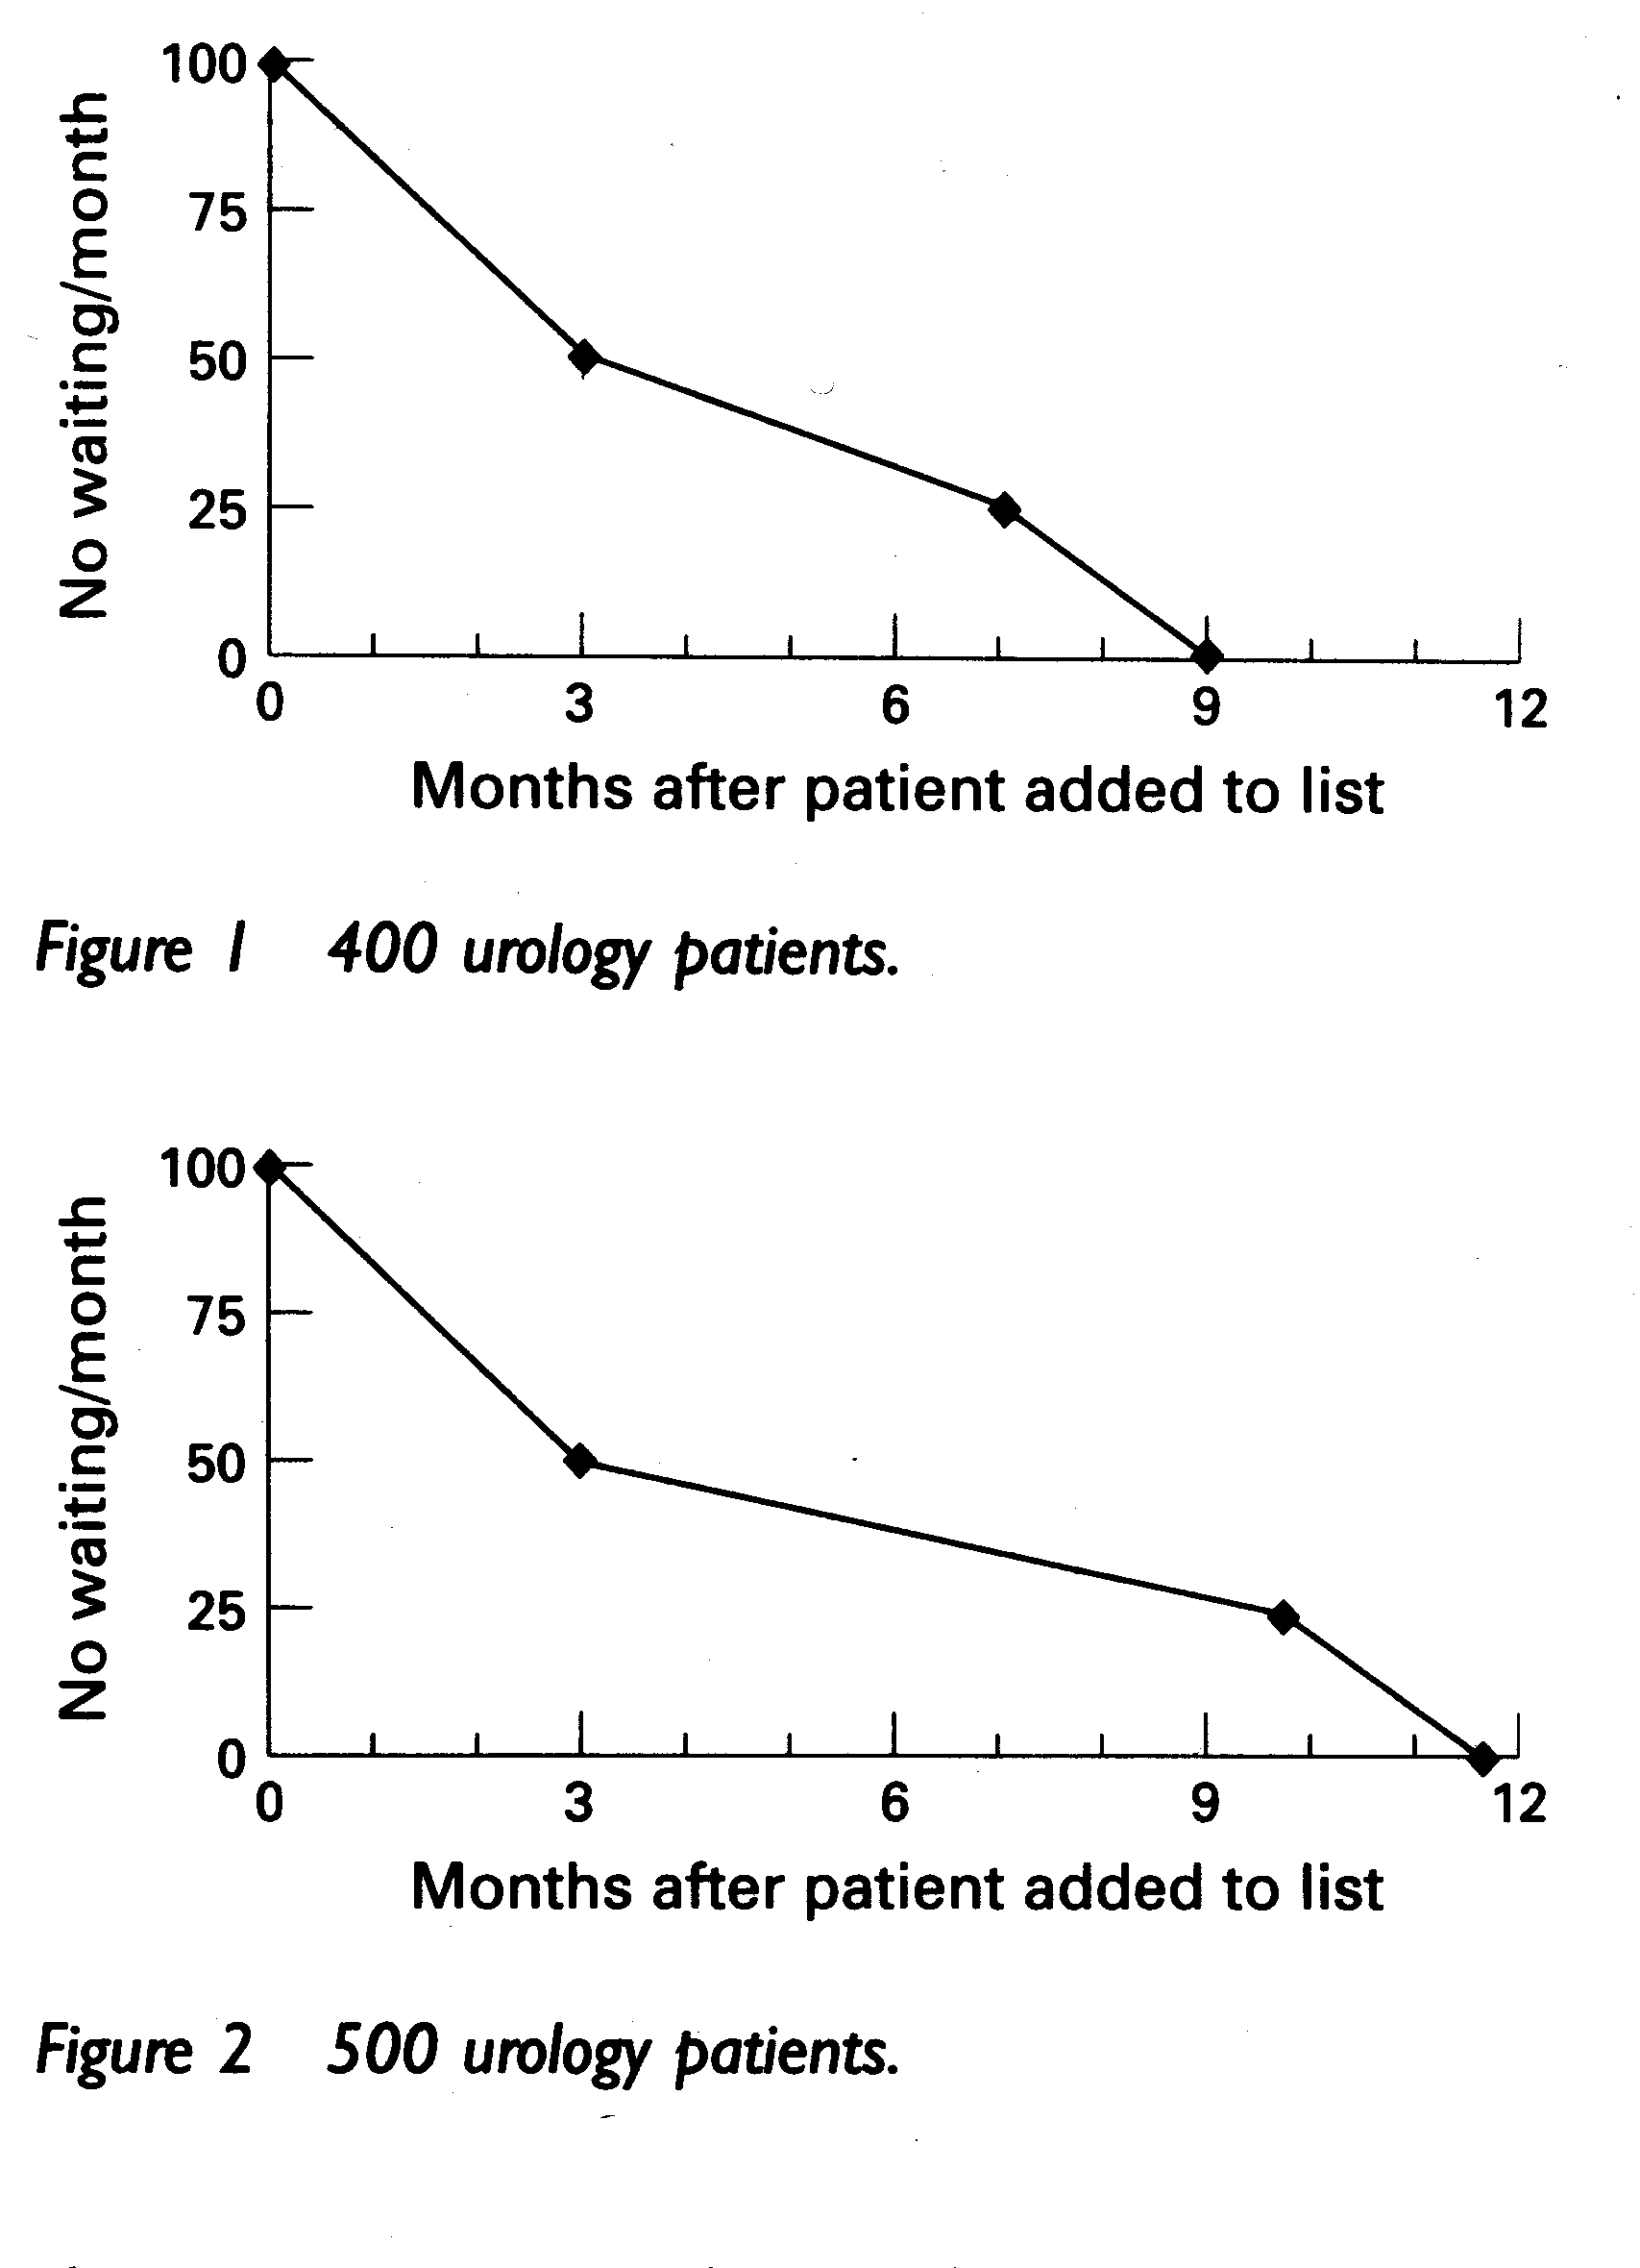
So in 1998 the state of the art for linking the number of patients waiting with the time they waited looked like this (figure taken from: Findlay R (March 1998) Getting to grips with waiting times. Clinician in Management, 7(1), 41-45):

In the pictures above, 100 patients are being added to the waiting list every month. Half of them are admitted urgently within 3 months. Then a quarter are admitted from the middle of the waiting list, and the remaining quarter roughly wait their turn. To reduce maximum waiting times you could reduce the number of patients waiting, reduce the number admitted urgently, or increase the number admitted in turn.
The above description of urgent patients is good, and the (rather hand-waving) assumptions about routine patients are good enough to be useful. At any rate, this description was sufficient to build the first capacity planning model that took reasonable account of waiting times. But in my subsequent travels I was constantly reminded of the shortcomings of this model, especially by operational waiting list managers and doctors who asked a lot of pertinent questions (to which I did not have satisfactory answers) about the effects of cancellations, running a fully-booked service, fluctuations in demand, and so on. Clearly, there was more work to do.
Twelve years have passed since then, and you would expect things to have moved on. They have. Today the state of the art looks like this:
This is a freely-available discrete event simulation (DES) model called Gooroo SimView. In the top left quadrant, you can see patients arriving onto and being admitted from a waiting list. In the bottom right quadrant, you can see the appointments that (some of) those patients have been given. (So those patients who have appointments appear in both quadrants.) The simulator, like real life, is quite complex and you can find full descriptions in Gooroo SimTrainer (which comes with reference notes) and the relevant research White Papers.
One of the many virtues of using a DES model to study patient scheduling is that it leaves you with no hiding place if your assumptions or methods are wrong. If your booking tactics aren’t very good, then you end up with long-waiting patients lingering insolently on the left of your waiting list, or delayed urgent patients glaring at you from their dangerously-late appointment slots. The model, like real life or any doctor, forces you to take account of every single patient.
It took a long time to explore all the implications of this model, but it was worth it. The result is a comprehensive understanding of waiting list dynamics, covering routine patients as well as urgents, and you can find a full write-up in Gooroo’s research White Papers. No more hand-waving assumptions.
So now, our calculation of the achievable waiting time target takes account of: referral rates, list size, clinical urgency, randomness, cancellations and removals, and whether appointments are given immediately after referral or closer to the appointment date. This is a much better description of a real waiting list than was available before, and the full calculation is freely-available in Gooroo’s Booking Rules Calculator (which you see just after logging in), and is also incorporated into Gooroo Planner for bulk capacity planning to meet waiting time targets.
It would have been really nice to have had all this back in 1994. But back then I didn’t even have a mobile phone or an internet connection. Things have moved on a long way since then, and that includes the way we calculate our achievable waiting time targets.
