

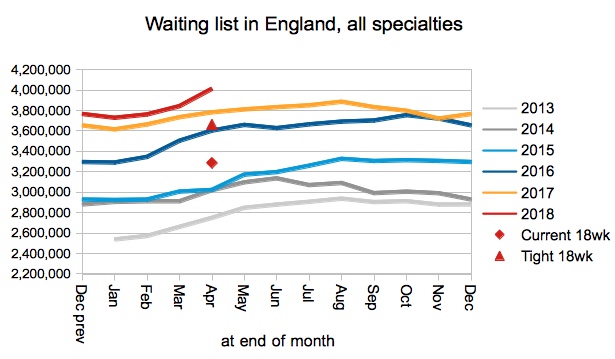
The English waiting list grew to a record-breaking 4,187,991 patients in April, after adjusting for non-reporting trusts, narrowly passing the previous high of 4,186,974 patients that was set by the very first RTT waiting list data in August 2007.
Back in those early years the RTT waiting list was falling very sharply, as the last Labour government poured money into the NHS to achieve the 18 week waiting time target for the first time. At its smallest, back in January 2010, there were just 2,315,060 patients on the adjusted waiting list.
Now all those gains have been lost. Waiting lists are the relentless accumulation of the NHS’s failure to keep up with the demand for elective healthcare. This latest milestone marks the moment when the NHS has failed to keep up with demand since RTT records began.
For analysis of waiting times performance at a particular organisation, visit our reports page. You can also access maps of the latest waiting times across England for A&E, cancer, and RTT.
In the following discussion, all figures come from NHS England. If you have a national statistic that you’d like to check up on, you can download our RTT waiting times fact checker.
England-wide picture
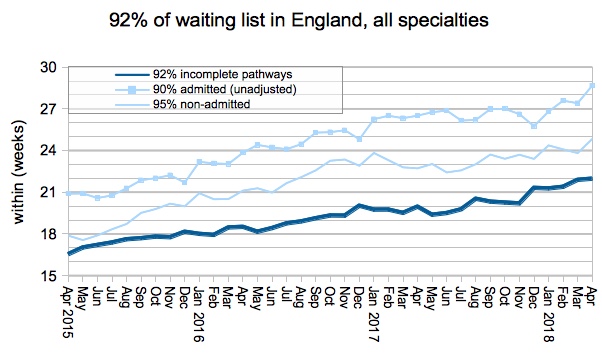
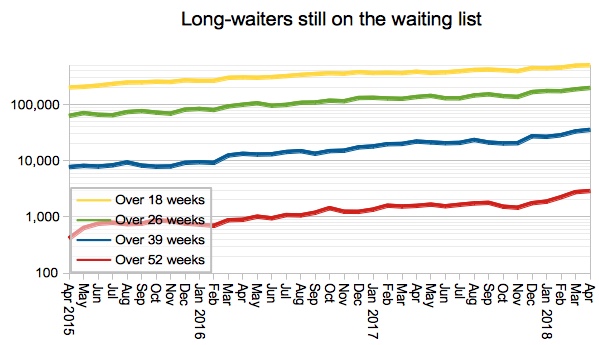
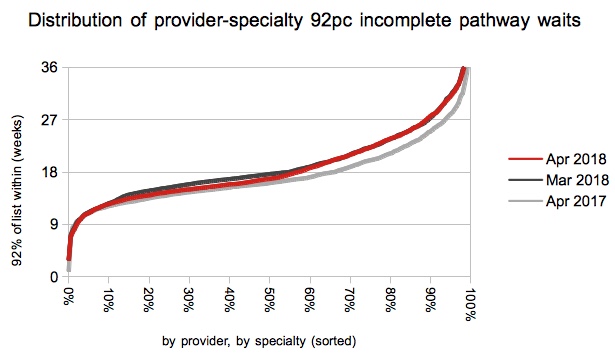
Waiting times are now so long that I had to extend the scale on the chart below. Even though trusts were making enormous efforts to treat long-waiting patients, waiting times nevertheless edged up.
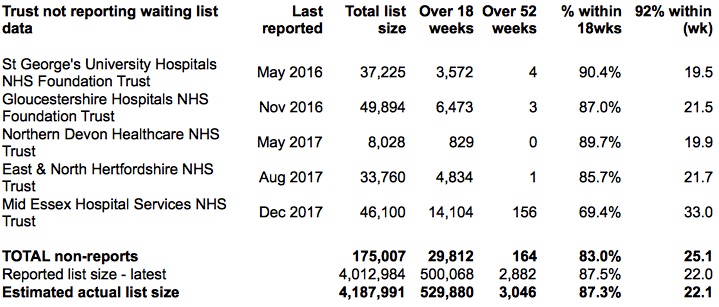
The figures I quoted at the start were adjusted for non-reporting trusts, and the table below shows how the adjustments stand, now that Barts NHS Health Trust have resumed reporting for the first time since August 2014.
Barts returned to the data series with a total waiting list of 88,333 (compared with their August 2014 list which was 75,578), of which over-18-week waiters stood at 13,988 (was 11,602), of which over-52-week waiters stood at 36 (was 86). In other words, their figures didn’t apparently change by a huge margin while they were away, so their return has not in itself caused a significant change to the adjusted figures (although the unadjusted figures are affected by the addition of this huge waiting list).
Which explains why, as we return to the unadjusted data on which all the charts are based, the apparent sudden growth in the waiting list is almost entirely caused by Barts NHS Health Trust starting to report their data again.
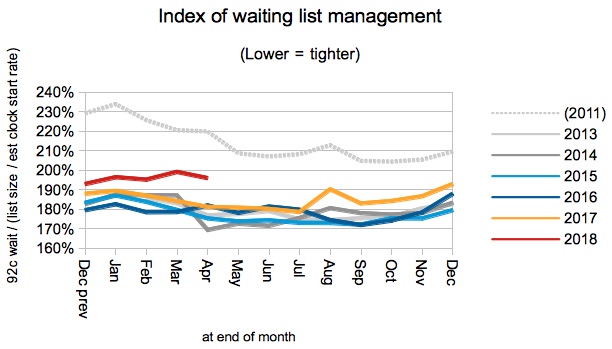
The index of waiting list management reflects the shape of the waiting list, and is driven by imbalances between waiting lists and the extent to which patients are treated in turn. This index remained mid-way between the improved management seen in recent years, and the looser management that prevailed when there were more perverse incentives in the RTT targets. It is difficult to tell why performance is worse than it was, but capacity pressures are a plausible explanation as they would make it difficult to admit complex cases.
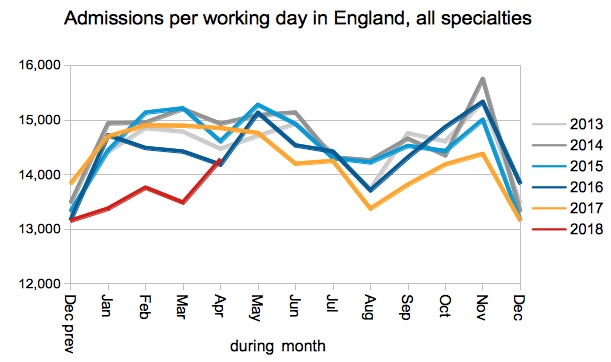
Winter finally ended in April, as admissions per working day rose sharply from their woefully low winter levels to rejoin the pace of recent years. It is perhaps no coincidence that A&E waiting times recovered in the same month.
One year waits rose again to 2,882 (or 3,046 if you adjust for non-reporting trusts), which is the highest since July 2012.
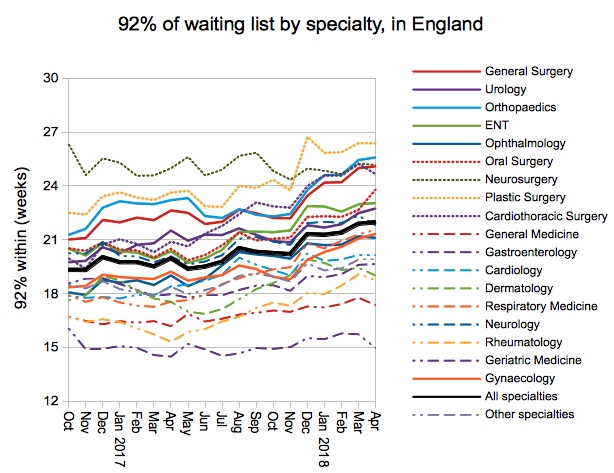
At specialty level, the big surgical specialties of Orthopaedics, General Surgery and Gynaecology all increased their waiting times. Only General Medicine and Geriatric Medicine remain within 18 weeks.
Local detail
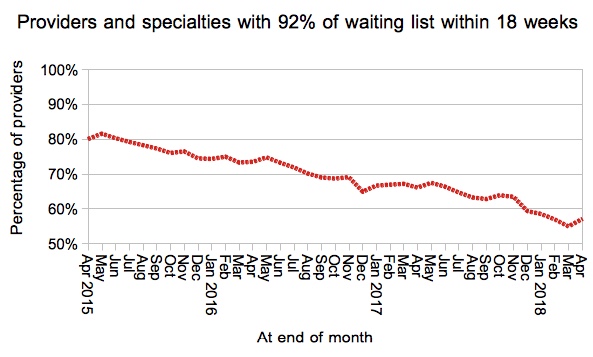
The proportion of local services achieving 18 weeks ticked up slightly, to 57 per cent.
Most of the improvement was, however, seen at the shorter-waiting end of the waiting time spectrum, as the “March kink” relaxed back to the usual smooth shape that we see in every other month of the year.
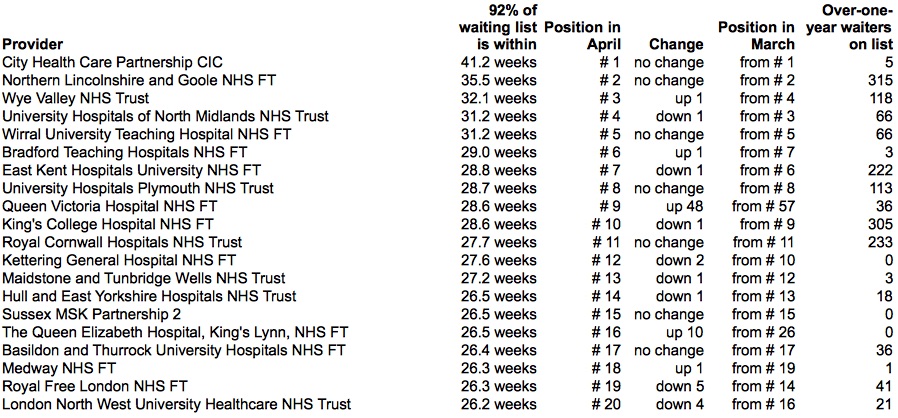
Looking at the top twenty longest-waiting providers in England, the Queen Victoria Hospital NHS Foundation Trust leapt 48 places during April to reach number nine in the table. This is a big change from March, but is just two places higher than they were in February. A quick scan of their May Board papers suggests that reporting difficulties at spoke sites may underlie their variable performance.
RTT data for May is due out at 9:30am on Thursday 12th July.